July 10, 2026
Someone Just Bet $20M on IWM
Featured: Someone Just Bet $20M on IWM

|
As former head of DOGE, Musk got an inside look at the true state of government finances… and what he found shook him. He’s gone public with his most urgent warning yet. A little-known IRS loophole may be the only thing standing between your retirement savings and what’s coming. Request Your 2026 Wealth Protection Guide Here.
FEATURED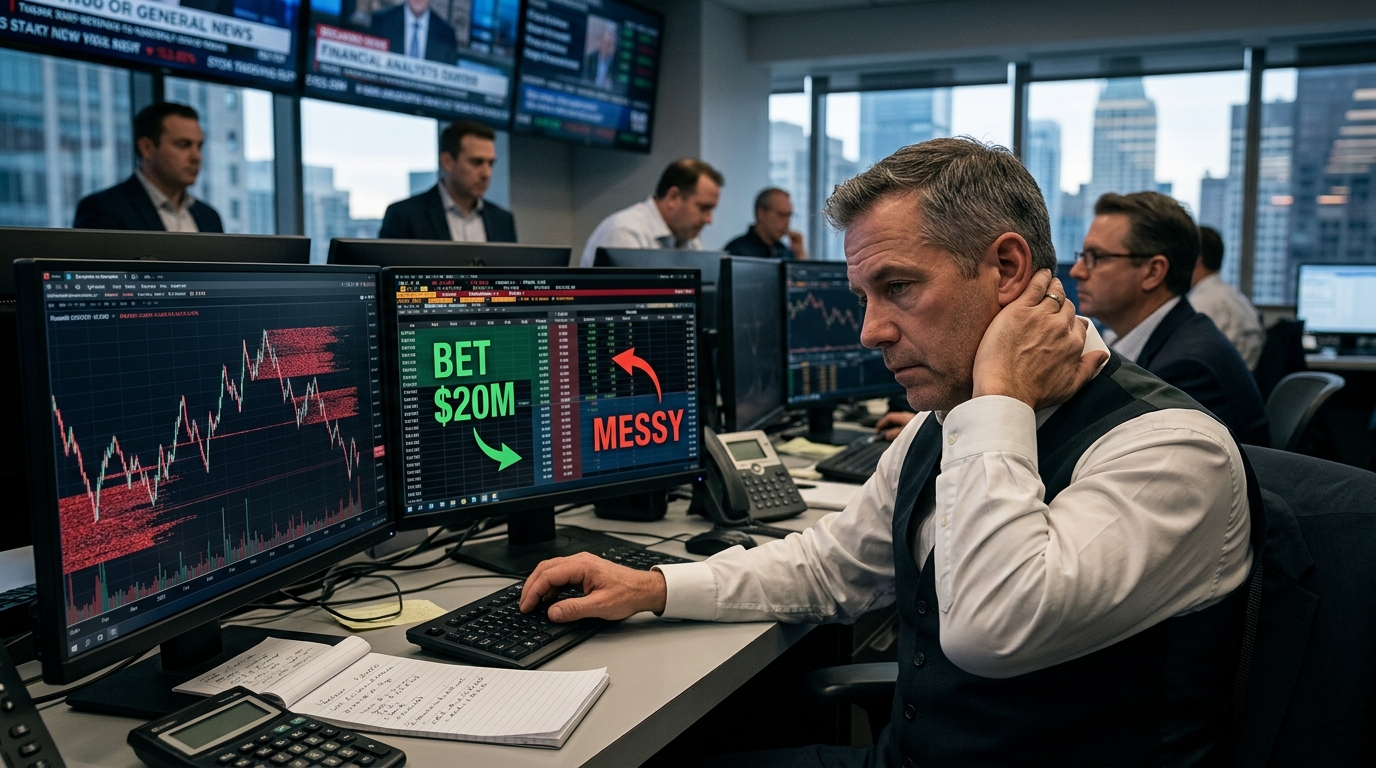
Someone Just Bet $20M on IWM
The Russell 2000 just posted its best first half since 1991. That is not framing or spin. That is the data.
The index gained roughly 22% through June 30, while the S&P 500 gained about 9% and the Nasdaq rose around 13%. Small caps outperformed large caps by more than 12 percentage points in the first six months of 2026 — the widest first-half gap since 2001. Franklin Templeton noted that all 11 sectors in the Russell 2000 ended the first half in positive territory, with technology the biggest contributor, followed by industrials, financials, and healthcare.
By most definitions, this is a genuine shift in market leadership. Not a seasonal blip.
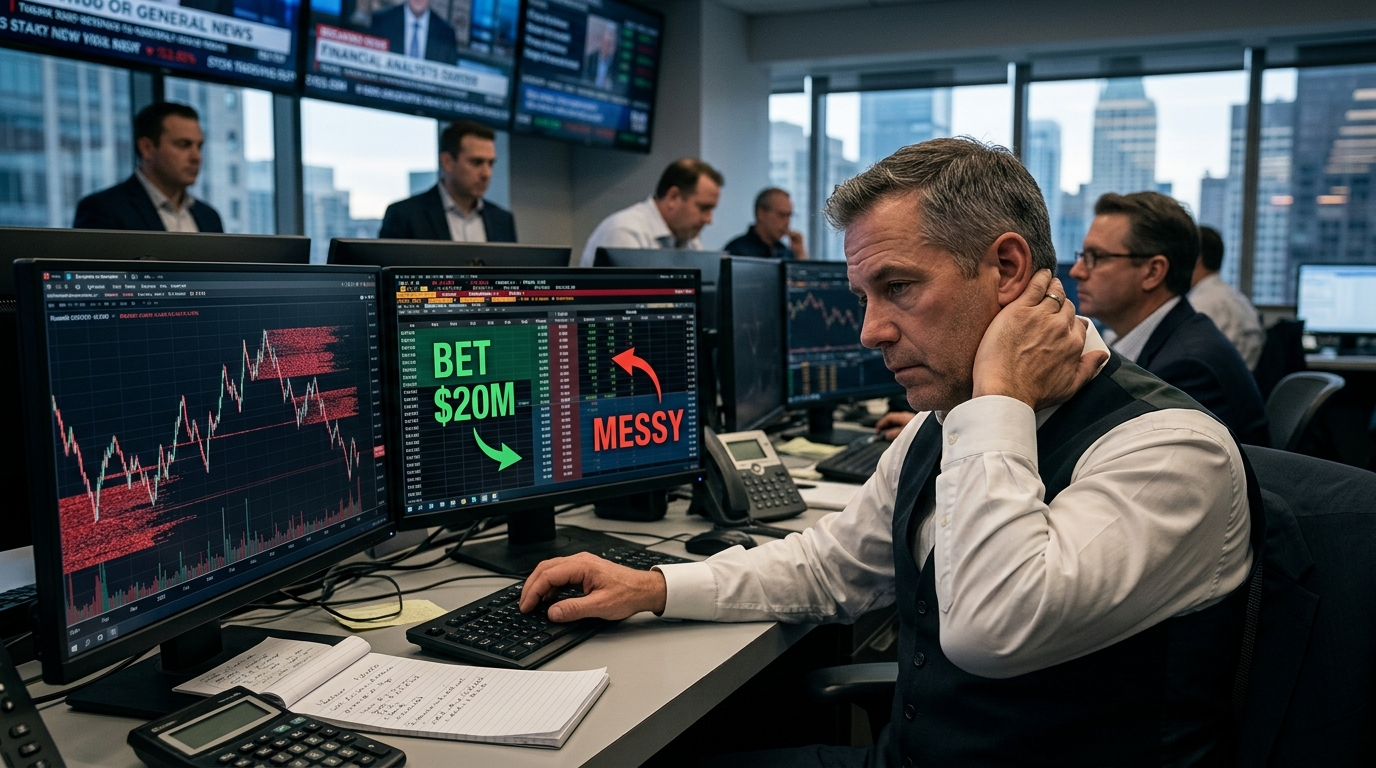
And then someone walked in and spent almost $20 million betting it all gets chaotic by December. Or goes parabolic. They are not sure which, and that is the point.
The Trade Getting Attention
A single trader in the iShares Russell 2000 ETF put on a position last week designed to profit from a significant move in either direction by mid-December. Per reporting from CNBC, the trader spent $11 million buying 15,000 of the 270-strike puts expiring December 18 and another $7 million on the same number of 335-strike calls at the same expiry. A classic long strangle.
Nvidia Just Made a Very Unusual Bet
The AI giant recently partnered with Los Alamos National Laboratory and backed a project connected to the technology known as the “Energy Cube.”
Why? Because AI can’t run without it.
And a major government milestone expected this August could change everything.
The math: the trade makes money if IWM drops roughly 11% or rallies about 14% from recent levels by December 18. It loses if the index just drifts sideways for the next five months.
What is interesting here is not just the size. It is the timing. IWM is currently trading around $296, up roughly 20% year to date. Q2 earnings season is just opening. The FOMC meets July 28-29. And for a basket of companies that tend to carry more floating-rate debt than their large-cap counterparts, any surprise shift in the rate outlook hits disproportionately hard and fast.
Slight tangent worth noting: the Russell 2000’s 21% gain in Q2 alone was the eighth-biggest quarterly move in the index’s history and the strongest quarterly showing since 2020, according to Strategas Research Partners. That kind of velocity, sustained into earnings season, is exactly the environment where a strangle this size starts making sense.
The Bull Case
The case for continued small-cap strength is not nothing. Earnings growth consensus for Russell 2000 companies in 2026 has been cited above 40% year-over-year — Seeking Alpha’s quantitative team noted this figure in early June, and at least one investment manager noted seeing forecasts for 20%-plus earnings growth circulating in the market as recently as this week. That is a meaningful number if even partially delivered.
The macro context matters too. Roughly a third of Russell 2000 constituents carry floating-rate debt, meaning they are acutely sensitive to borrowing costs. The Fed cut rates 75 basis points in late 2025, and the current federal funds rate sits at 3.50-3.75%. That 75bps of relief has flowed through balance sheets over the past several quarters, and Q2 2026 earnings will be among the first full quarters to reflect materially lower floating-rate costs for many of these smaller companies.
There is also the AI application angle. The infrastructure layer of AI — chips, data centers, high-end compute — is dominated by mega-caps. But the application layer, meaning companies building software, automation tools, and AI-adjacent solutions for specific industries, skews heavily toward small caps. If Q2 reports show AI adoption starting to show up in revenue lines for smaller companies, that is a new catalyst investors have not fully priced yet.
Missed the Gold Boom?
Think Again We found a $15 fund tied to gold that is delivering 64% in annual distributions. And the next payout is just days away.
The Bear Case Is Also Real
Here is where it gets more complicated. The Fed under new Chair Kevin Warsh has shifted to a notably more hawkish posture. At the June FOMC meeting, the committee held rates steady at 3.50-3.75% but dropped forward guidance favoring cuts. The updated dot plot showed nine of 19 officials projecting at least one rate hike by year-end 2026. That is a meaningful shift from what markets had priced just months ago.
As of July 9, futures markets were pricing roughly a 73-84% probability of no change at the July 29 meeting, with a 15-27% implied probability of a 25 basis point hike. That hike probability has climbed from around 12.5% just a month ago. For a collection of companies with meaningful floating-rate debt loads and a sizable share that are still unprofitable, even the threat of a hike changes the math on refinancing and cash burn projections. You do not need the hike to actually happen. The repricing of expectations alone can move small-cap stocks meaningfully.
The 10-year Treasury has been hovering near 4.5%, which sits in the upper range of the past 12 months, keeping the cost of capital tight for these companies even as the Fed has been nominally in easing mode. Small-cap balance sheets are not built for a prolonged higher-for-longer environment, and the market is increasingly being forced to reckon with that possibility.
There is also the question of what the recent Russell reconstitution changed. For the first time in 37 years, FTSE Russell moved to a semi-annual rebalancing schedule in 2026. The June reconstitution was the first under this new structure, and it reshuffled index composition in ways that institutional managers are still digesting. Changes in sector weights — particularly around financials and cyclicals — affect how IWM responds to macro signals going forward.
Options Framework: The Parameters That Matter
The institutional strangle defines the range the market is currently assigning for meaningful movement: 270 to 335 on IWM, with December 18 as the decision date. That is the framework most active traders should keep in mind when sizing any directional bet over the next several months.
For traders who believe the rally continues through earnings season and Fed risk is overstated, a bull call spread in IWM — buying the August 300 call and selling the 320 call — offers a defined-cost way to participate in the upside without unlimited premium exposure. If small-cap earnings broadly beat expectations, this structure captures that move with capped risk. Defined risk only.
For traders expecting the Fed or earnings to disappoint, a bear put spread — buying the August 285 put and selling the 270 put — defines the downside risk while targeting a pullback toward the lower end of the strangle range. Defined risk only.
For traders who simply want exposure to the directional uncertainty without picking a side — which is arguably the most intellectually honest position here given the competing forces — a smaller long strangle or long straddle on IWM with October or December expiry mirrors the institutional bet at a fraction of the cost. The logic is the same: something significant happens by year-end, and the current environment gives you plenty of legitimate catalysts in either direction.
The Fed Meeting Is the Actual Catalyst
The FOMC meets July 28-29. The rate decision drops July 29. Markets are currently pricing the hold as the base case, but the implied probability of a hike has more than doubled in the past month — rising from roughly 12.5% to nearly 22-27% depending on the source. That shift in expectations, even without an actual hike, has already started affecting small-cap positioning.
Earnings season adds another layer. Big bank reports begin the week of July 14. Small-cap Q2 results filter in throughout July and into early August. If the earnings beats are real and broad — particularly in regional banks, which are the single largest sector within the Russell 2000 and stand to benefit most from lower floating-rate costs — the bull leg of that strangle gets activated. If reports disappoint or H2 guidance gets revised lower, the put leg becomes the relevant conversation.
“Billionaire’s Backdoor” Strategy Reveals New AI Winners
The richest tech billionaires – Bezos, Gates, Musk, and more – are quietly shifting their money into a new kind of asset. It’s not gold or crypto. It’s not AI software or the massive Mag 7 trade. Instead, it’s a next-phase AI play that’s closed to most investors. However, we’ve worked out a “backdoor” strategy you could still use to get in, for as little as $50 a share.
What matters most over the next four weeks is not whether IWM goes up or down. It is whether the volatility priced into that $20 million bet turns out to be justified. Right now, virtually every macro signal in the environment suggests it probably is. The only question is which direction triggers it first.
Key Levels and Data Points to Track
- IWM H1 2026 performance: approximately 22.1% — best first half since 1991
- S&P 500 H1 gain: approximately 9% | Nasdaq H1 gain: approximately 13%
- Small-cap outperformance vs. large caps: more than 12 percentage points in H1 — widest since 2001
- IWM current price: approximately $296
- Institutional strangle: $11M on 270-strike puts / $7M on 335-strike calls, December 18 expiry
- Strangle breakevens: IWM must fall approximately 11% or rally approximately 14% to profit
- Russell 2000 Q2 2026 gain: approximately 21% — 8th biggest quarterly move in index history (Strategas Research Partners)
- Fed funds rate: 3.50-3.75% (current target band, unchanged since late 2025 easing cycle)
- FOMC meeting: July 28-29 — hold probability approximately 73-84%, hike probability approximately 15-27% as of July 9
- Russell 2000 floating-rate debt exposure: approximately one-third of constituents carry floating-rate debt
- Russell reconstitution: moved to semi-annual schedule in 2026 (June and December)
- Bull bias structure: August bull call spread, 300/320 strikes — defined risk
- Bear bias structure: August bear put spread, 285/270 strikes — defined risk
- Volatility bias (no directional view): long strangle or straddle, October or December expiry
For informational and educational purposes only. Not investment advice. Trading involves risk, including loss of principal.