August 14, 2026
The AI Infrastructure Trade Is Live
Featured: The AI Infrastructure Trade Is Live
Dear Reader,
This is important, so I’ll get right to it…
An estimated $10 TRILLION could flow through a little-known government initiative unfolding behind the scenes.
According to Wall Street’s forensic accountant, Joel Litman, the companies positioned to benefit may surprise almost everyone.
It could all come to a head on November 27.
Joel is the analyst who warned of the 2008 collapse months before Lehman Brothers fell… called the 2020 COVID crash, then pinpointed the bottom almost to the day… and flagged Nvidia and Micron long before Wall Street caught on.
Which is why some of the world’s biggest money managers pay his institutional firm up to six figures a month to see what he sees.
Joel believes his latest findings could dwarf every one of those calls combined – and understanding where that money goes could be one of the most important financial decisions you’ll make.
He has laid the whole story out in a new video. Almost none of the mainstream press is covering it. Joel walks through it all, start to finish.
Watch his new briefing before the deadline.
Regards,
Rob Spivey
Managing Director, Altimetry
P.S. Joel has pinpointed November 27 as the day the broader market gets forced to wake up to this shift. The people best positioned are the ones who move before that date – not after. His video explains exactly why. See it here.
The AI Infrastructure Trade Is Live
Market Snapshot
The S&P 500 pushed above 7,780 this week and notched a fresh record close, with the next technical target debated around 8,000. Breadth is the constructive piece: the majority of S&P 500 stocks are trading above both their 20-day and 50-day moving averages, the McClellan Oscillator is confirming advancing volume over declining volume, and the new highs list is expanding. Realized volatility over the trailing 10 sessions is sitting below its 25th percentile, which historically has supported continued risk appetite rather than mean-reversion conditions.
The 10-year Treasury yield moved to 4.67% on Friday, a 2 basis point pickup that reflects geopolitical tensions in the Middle East keeping oil prices elevated and, by extension, keeping a Fed rate cut off the near-term table. New Fed Chair Kevin Warsh has not offered markets any relief on rates, and stubborn inflation has pushed consensus toward a September pause rather than a cut. That yield level is not breaking anything, but it narrows the valuation cushion on high-multiple industrials.
The environment favors stock-specific momentum with a sector rotation bias. Mega-cap tech has handed the baton to AI infrastructure names over the past two weeks. CoreWeave reported a revenue backlog of $104.2 billion and jumped 19%. Super Micro Computer issued a stronger-than-expected FY2027 revenue outlook. Dell closed up nearly 10% on August 12 alone in sympathy. The sector-level bid in AI infrastructure hardware and power is real and it has legs into a concrete catalyst: Dell’s fiscal Q2 FY2027 earnings on September 3.
That is where active traders should focus their attention right now. Not on the GPU designers. On the layer underneath them.
Why These Four Stocks Are in Focus
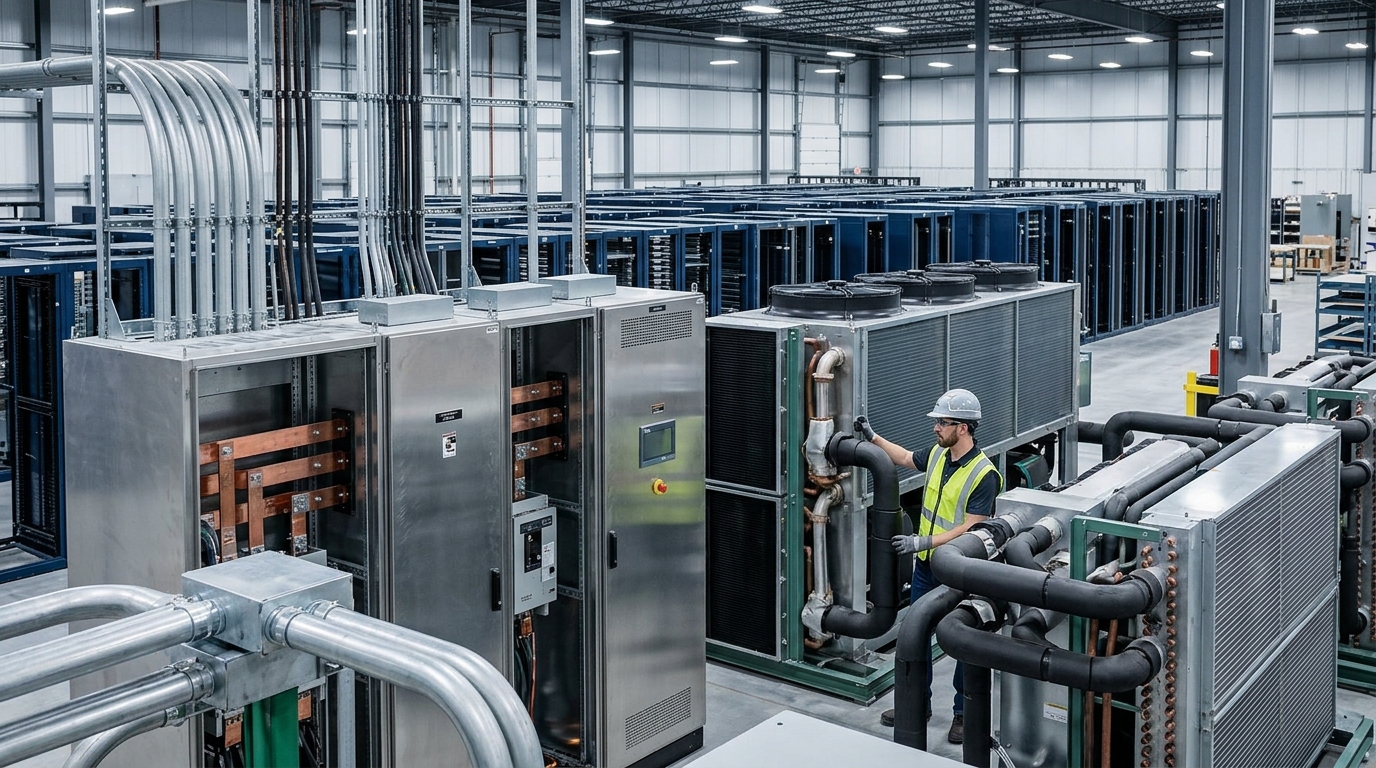
GE Vernova (GEV), Vertiv (VRT), Eaton (ETN), and Dell (DELL) each reported earnings in the last three weeks. All four beat on core operating metrics. All four raised full-year guidance. And all four are directly levered to the same underlying force: the electricity, cooling, and server infrastructure that every AI data center requires before a single GPU can run a model.
Most traders are still watching the chip layer. The infrastructure layer is where the earnings quality sits right now. GEV posted Q2 orders of $24.2 billion, up 88% organically, and raised its free cash flow guidance to $11.5 billion to $12.5 billion for the full year. VRT delivered adjusted free cash flow of $925 million in a single quarter, up 234% year-over-year, and guided full-year net sales to $13.8 billion to $14.2 billion. ETN posted a Q2 record with $8.53 billion in revenue, up 21%, a book-to-bill of 1.2, and a US data center electrical backlog that has grown to 307 gigawatts. Dell’s Q1 FY2027 AI server revenue hit $16.1 billion, up 757% year-over-year, with $43 billion in AI backlog carried into Q2 and a full-year AI revenue target of approximately $60 billion.
Each of these names is at a different point in its technical structure, which means the entry considerations are different for each. That is what the rest of this issue is about.
Technical Picture
GE Vernova (GEV) — Consolidating at the 50-Day, Watching the $1,034 to $1,063 Resistance Band
GEV is trading near $1,011 to $1,016 as of this week, sitting just above its 50-day simple moving average at approximately $1,038, after a pullback from the post-earnings highs. The stock fell roughly 7% on July 22 after adjusted earnings of $2.47 missed the $3.04 Street estimate, despite the backlog and order numbers being unambiguously strong. That earnings-day gap lower created a well-defined resistance band between approximately $1,034 and $1,063.
RSI has pulled back to the mid-40s, which places the stock in a neutral zone rather than oversold territory. MACD is slightly positive. The 200-day SMA, at approximately $808, is well below current price, meaning the long-term trend is intact. The Bollinger Bands (25-period) show GEV trading toward the midpoint of the band between approximately $957 and $1,123, suggesting no immediate mean-reversion pressure in either direction. Key support levels sit at $1,005, $993, and $977. Resistance at $1,034, $1,051, and $1,063 needs to clear before the stock can challenge its prior highs. Morgan Stanley raised its price target to $1,350 on July 23, and the analyst consensus of 29 analysts sits at Strong Buy with an average target near $1,238.
Vertiv (VRT) — Post-Earnings Selloff Creates a Technical Reset
VRT is trading in the $268 to $276 range today, with a 52-week range of $118.70 to $379.94. The stock sold off sharply after Q2 earnings on July 29, with multiple analysts cutting price targets: RBC to $337 from $418, Goldman to $301 from $352, KeyBanc to $325 from $360, Oppenheimer to $325 from $353, and Baird to $320 from $370. The selloff was attributed to a top-line miss of approximately $110 million, which management attributed to supply chain timing and project phasing rather than demand deterioration. The consensus analyst rating remains Strong Buy across 21 to 28 analysts, and the average 12-month price target sits in the $337 to $349 range, implying meaningful upside from current levels.
The post-earnings gap lower has produced a technical reset. Average daily volume is approximately 5 million shares, so liquidity is sufficient for active traders. The key near-term question is whether the $268 to $270 area holds as a base for a rebound, or whether the stock tests the lower end of its recent trading range. The H2 earnings recovery that management explicitly guided toward, with full-year adjusted free cash flow of $2.4 billion to $2.6 billion implying a large step-up from the $925 million single-quarter figure in Q2, is the catalyst that could reattract institutional buyers in September and October.
Eaton (ETN) — Breaking Out to All-Time Highs
ETN is the strongest chart in this group right now. The stock closed at $453.33 on August 13 and reached an all-time high of $463.75 on August 11, just three weeks after its Q2 earnings beat. The 52-week range is $311.92 to $478.00, which means the stock is trading in the upper quartile of its annual range and pushing toward the 52-week high. Analyst price targets have moved up sharply post-earnings: RBC raised to $512, Citi raised to $485, and BMO Capital raised to $487. The consensus target is approximately $431 to $485 depending on the aggregator, though several of the most active analysts are now above $485. The Mobility separation catalyst, targeted for Q1 2027, remains an unpriced re-rating event.
The prior Q2 earnings reaction was constructive rather than explosive, which means the stock is grinding toward all-time highs on the back of fundamental revision rather than a single-day gap. That is generally a more durable technical structure than a gap-and-fade. The $450 area is becoming near-term support. A hold above $450 would allow momentum traders to frame a continuation toward $478 and potentially the $485 to $512 target zone. A break below $445 would suggest the post-earnings rally is fading and warrant caution.
Dell (DELL) — Ran to $514 Record, Now Testing $484 to $494 as New Support
DELL is the most actively traded name in this group right now. The stock closed at $484.50 on August 12, up nearly 10% in a single session after CoreWeave and Super Micro results confirmed the AI infrastructure buildout remains broad and well-funded. The stock hit an all-time high of $514.00 on August 13 before pulling back to approximately $494. The 200-period moving average on the 15-minute chart sits near $483.93, offering a near-term dynamic support reference. The 50-period MA is around $463. The $514 record high is the immediate resistance level; a clean hold above $494 and a subsequent push through $514 would open the path toward the $500 to $512 analyst target zone. Morgan Stanley cut its target to $430 from $477 on August 7, which represents the low end of the current range of analyst views. The average 12-month target across 27 analysts is approximately $501.
The critical upcoming event is fiscal Q2 FY2027 earnings on September 3, 2026. Q1 FY2027 adjusted EPS of $4.86 beat the Street by roughly 64% and triggered a 32.76% gain on the day. The Q2 print is now the primary catalyst for the next directional move, and traders should plan their positioning framework around it explicitly.
The Catalyst
The catalyst driving all four names is the same: hyperscaler AI capital expenditure is running at historically unprecedented levels, and the physical infrastructure required to support it is constrained in ways that are visible in firm order books, not just in optimistic analyst models.
GEV CEO Scott Strazik told investors in July that the company is taking slot reservation agreements for 2031 gas turbine deliveries. Gas turbine backlog and slot reservation agreements sit at 116 GW, targeting at least 125 GW by year-end. That is not a demand forecast; it is a manufacturing capacity constraint visible in signed agreements. Data center electrification orders have already exceeded $5 billion year-to-date, more than double the full-year 2025 total.
VRT’s service revenues grew 32.9% year-over-year in Q2, outpacing product growth. That tells you the installed base is generating recurring demand independent of new data center construction. Every megawatt that GEV routes to a data center generates heat that VRT has to manage. The physics of this relationship does not change based on model efficiency gains.
ETN’s Electrical Americas rolling 12-month orders were up 41% year-over-year as of Q2, with a book-to-bill of 1.3. The US data center electrical backlog has grown to 307 gigawatts, which management described as approximately 15 years of backlog at current production rates. The company is investing more than $1 billion in capacity expansion across two dozen projects in Electrical Americas alone.
DELL’s Q1 FY2027 print confirmed that enterprise and sovereign AI buyers are now pulling alongside hyperscalers. AI backlog entering Q2 FY2027 stood at $51.3 billion following Q1 orders of $24.4 billion and shipments of $16.1 billion. The September 3 earnings report will confirm or challenge whether that backlog is converting at the pace the FY2027 $60 billion AI revenue target requires. Roughly $15 billion per quarter in AI server revenue is needed to reach that number. Q1 was $16.1 billion. The bar is set.
Your Free Options Book Is About to Vanish
In case you missed it… make sure you get your free “Simple Options Trading For Beginners” book before your link expires.
I eventually plan to charge money for this training, so do yourself a favor and download it now…
That way, no matter what it costs in the future, you’ll have a free copy.
Sound good?
Risk Assessment
The primary risk to the entire group is a shift in hyperscaler capital expenditure guidance. Microsoft, Amazon, Alphabet, and Meta will all update capex outlooks in October earnings calls. Any language suggesting a pause, consolidation, or re-prioritization of AI infrastructure spending would pressure order books at all four companies simultaneously. GEV and VRT have backlog to cushion near-term revenue; DELL and ETN are more sensitive to forward order signals.
For GEV specifically, the wind segment remains a drag. Management guided for a full-year wind EBITDA loss of approximately $400 million. Any quarter where that loss widens, or where the conversion rate from slot reservation agreements to firm orders disappoints, is a meaningful EPS risk given that the Q2 adjusted EPS of $2.47 already missed the $3.04 consensus by a wide margin. The Power and Electrification segments carried the quarter; if either shows order softness, the premium multiple compresses quickly.
For VRT, the Q2 revenue miss of approximately $110 million was attributed to timing. If Q3 does not show the catch-up shipments management guided toward, the timing explanation becomes a structural concern. The stock is already down significantly from its 52-week high of $379.94. A second consecutive revenue miss would be a thesis-level event, not a buying opportunity.
For ETN, the risk is integration complexity. The Boyd Thermal acquisition and the pending Mobility separation are both absorbing management bandwidth. A book-to-bill below 1.0 in Electrical Americas for any quarter over the next two quarters would signal demand deceleration. Watch that single number closely.
For DELL, AI server operating margins in the mid-single digits leave little room for component cost inflation. Any increase in NVIDIA GPU pricing, memory costs, or networking components would compress already thin margins on a $60 billion revenue line. The stock has quadrupled in 2026; that kind of run means the bar for the September 3 report is high, and any downside surprise on margins or guidance will be met with an outsized sell reaction.
Scenario Modeling
Bull case: DELL’s September 3 print confirms Q2 AI server revenue at or above $16 billion and the $60 billion full-year target holds. The sector-wide bid broadens. GEV clears the $1,063 resistance level and begins recovering toward the post-earnings gap fill around $1,100. VRT stabilizes above $268 and begins a base-building pattern ahead of Q3 results, with traders anticipating the H2 free cash flow recovery management guided toward. ETN continues its grind toward the 52-week high at $478 and eventually through it toward the $485 to $512 analyst target range. In this scenario, momentum traders have clear follow-through in all four names over the next one to three weeks.
Base case: DELL consolidates in the $480 to $500 range ahead of September 3, with the market waiting for earnings confirmation before committing to a sustained move above $514. GEV continues to trade in the $993 to $1,063 range, with the resistance band containing any rally until the next earnings cycle provides a cleaner EPS beat. VRT bases between $265 and $280 as analysts finish trimming targets and institutional positioning stabilizes. ETN holds $450 as support and trades sideways to modestly higher into the Mobility separation. All four remain on active trader watchlists; none provide a clean momentum entry without a confirming catalyst.
Bear case: DELL’s September 3 report misses on margins or guides Q3 AI revenue below $15 billion, triggering a sharp reversal from all-time high levels. The sell reaction spreads to GEV, VRT, and ETN as risk-off sentiment hits AI infrastructure broadly. GEV breaks below $977 support, VRT tests the $240 to $250 area, and ETN loses the $445 level. In this scenario, the Q2 earnings data points that looked compelling become noise against a forward guidance disappointment, and the group requires a reset before it becomes actionable again.
Active Trader Strategy Framework
These four names are not equal opportunity situations right now. They require differentiated approaches based on where each stock sits in its technical structure and where the next catalyst falls on the calendar.
- DELL — The Primary Focus for the Next 1 to 3 Weeks: The September 3 earnings date is a hard catalyst. The stock ran from below $400 to an all-time high of $514 in weeks. The current consolidation in the $484 to $494 zone, with the 200-period MA nearby at $483.93, is where the risk-reward calculus plays out. A hold above $484 into September 3 with the stock coiling below $514 sets up either a pre-earnings momentum trade or a post-earnings reaction trade depending on your tolerance for binary event risk. If you participate ahead of the print, define your stop clearly. A break back below $463 (the 50-period MA reference) would invalidate the near-term continuation structure. The primary thing to watch: whether AI server margin language in the Q2 report signals expansion or compression from the mid-single-digit baseline.
- ETN — The Cleanest Technical Structure: ETN is grinding toward all-time highs with a book-to-bill of 1.3 and a 307 GW backlog behind it. The $450 level is near-term support. Traders who want exposure to AI infrastructure without the September 3 event risk in DELL can express the same underlying thesis through ETN. The next re-rating event is the Mobility separation, targeted for Q1 2027. That provides a medium-term catalyst without a near-term binary earnings risk. Analysts at RBC have a $512 target; the path from $453 to $512 is a 13% move with a clearly defined risk level at $445.
- GEV — Waiting for the Resistance Breakout: GEV requires patience. The $1,034 to $1,063 resistance band is overhead, and the stock needs to clear it on volume to confirm the post-earnings gap fill is underway. The 50-day SMA at approximately $1,038 is acting as both near-term resistance and potential support. A confirmed close above $1,063 on above-average volume would be the technical signal that the post-earnings weakness has been absorbed. Until that happens, the risk is a retest of the $977 to $993 support zone. Position sizing should account for the wide Bollinger Band range ($957 to $1,123), which implies daily volatility is meaningful relative to the stock price.
- VRT — Tactical Opportunity Developing, Not Yet Confirmed: VRT’s post-earnings selloff from near $380 to the current $268 to $276 range is a 27% to 30% decline on a timing-related revenue miss. The fundamental data, $925 million in adjusted free cash flow in Q2 and a full-year free cash flow target of $2.4 billion to $2.6 billion, did not deteriorate. The opportunity is in identifying whether institutional buyers step in at current levels before the Q3 report confirms the H2 shipment catch-up. A sustained hold above $268 with volume normalizing toward the 5 million share daily average would signal accumulation. The risk is that supply chain timing proves more persistent than management guided, which would mean the Q3 report disappoints again at the revenue line. Do not add to a position that is not working before Q3 data is in hand.
Trader’s Checklist
These are the specific developments to monitor before acting on any of the four names over the next one to five sessions.
- DELL above $494: A sustained hold above that level with volume above the daily average signals that the August 13 all-time high at $514 is being defended as a base rather than rejected as a peak. A break below $484 to $483 raises the probability of a deeper consolidation into September 3.
- ETN above $450 on close: The $450 level is the line between a healthy consolidation above all-time highs and a warning that the post-earnings momentum is fading. Any session where ETN closes below $445 on volume above 2.5 million shares warrants a reduction of exposure.
- GEV volume on any push toward $1,034: A low-volume test of the resistance band is noise. A high-volume close above $1,063 is signal. Watch relative volume carefully on any GEV move toward the upper end of the current range.
- VRT daily volume relative to the 5 million share average: Days where VRT trades above 6 million shares on an up day are institutional accumulation signals. Days where it trades above 6 million shares on a down day are distribution signals. The difference in character of volume is more informative than price alone at this stage of the recovery.
- Nvidia’s August 26 earnings: Nvidia reports August 26, one week before DELL. Any commentary on GPU demand, data center capex commitments, or supply chain will move all four names. A strong Nvidia print with robust forward guidance would be a tailwind for the entire group heading into the DELL September 3 report.
- Hyperscaler capex language: Any update from Microsoft, Amazon, Alphabet, or Meta between now and their October earnings calls on AI infrastructure investment pace is a primary variable for GEV backlog conversion rates and DELL’s AI order intake trajectory.
- GEV wind EBITDA watch: The full-year wind EBITDA loss target is approximately $400 million. Any quarterly disclosure suggesting the loss is tracking wider than that number is the primary earnings risk for GEV over the next two quarters.
- ETN book-to-bill: If the next quarterly report shows Electrical Americas book-to-bill dropping below 1.0, the 307 GW backlog thesis starts to fray. That is the single most important data point in the ETN investment case.
Preparation beats prediction. What these four names have in common is that the fundamental case is now confirmed by real earnings data rather than forward estimates. The next question the market will answer is whether September 3 at Dell, Q3 reports at GEV and VRT, and the ETN Mobility separation close all continue in the direction the Q2 earnings cycle established.
The technical structures are different across the four. ETN is the cleanest. DELL has the hardest near-term catalyst. GEV needs to clear resistance before momentum players re-engage. VRT requires patience until Q3 data confirms the H2 recovery.
Traders who know what they are watching and what price would change their view are in a position to act decisively when the confirmation comes. Those who are reacting after the fact will be buying someone else’s entry. Define your levels. Respect the calendar. The infrastructure layer of the AI trade is not finished moving.
For informational and educational purposes only. Not investment advice. Trading involves risk, including loss of principal.