August 13, 2026
VLO Hit an All-Time High. Here’s the Trade.
Record gas prices, a $59 crack spread, and a Q3 earnings date on October 22. The move has legs — if you know where to look.
First a note from Weiss Ratings
Dear Reader,
In a few short months, the US government could make a sweeping change to bank accounts nationwide.
It will give them unprecedented powers to control your bank account.
They could closely track every transaction… even freeze it.
Fortunately, there are 4 simple steps you can take today that could safeguard your savings.
Discover these 4 simple steps here.
Good luck and God bless!

Martin Weiss
Dr. Martin D. Weiss, Founder
VLO Hit an All-Time High. Here’s the Trade.
Market Snapshot
The S&P 500 closed Wednesday at 7,748.50 and added another 0.71% in Thursday’s session, putting it within striking distance of a fresh record. The NASDAQ-100 led, up 1.25% to 30,114. The Dow added just 0.13%. That spread between tech-heavy and broad-market leadership is worth noting: the VIX held at 14.76 through the session, a level that signals options markets see no near-term dread, just a calm drift higher in concentrated pockets of the market.
Breadth is the more interesting story. On Wednesday, only 179 of 500 S&P members closed higher even as the index gained 0.26%. The equal-weight S&P 500 is outperforming the cap-weight version by 1.7 percentage points in 2026, up roughly 15% versus 13.3% for the headline index. That divergence is not a contradiction. It tells you gains are rotating into sectors beyond the large-cap technology core. Energy is one of those sectors, and it is not rotating out.
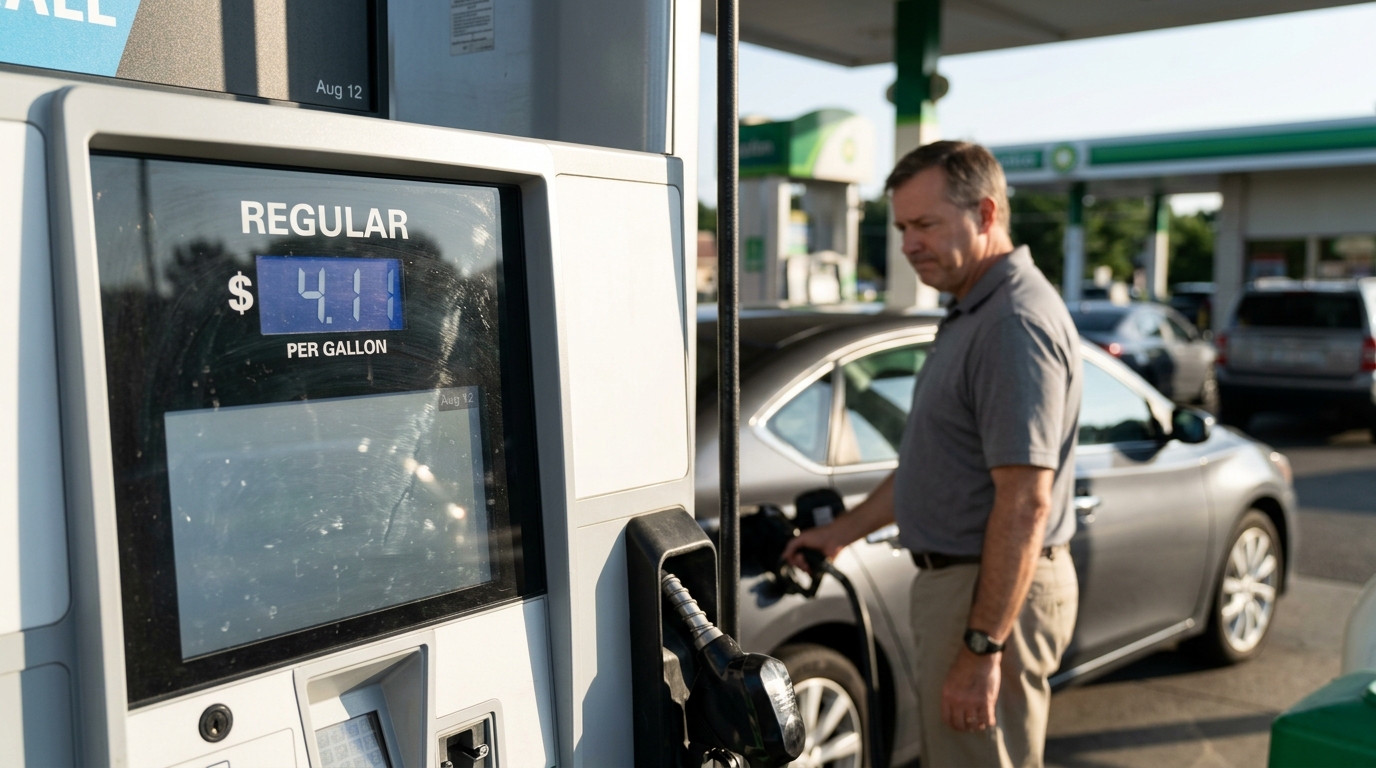
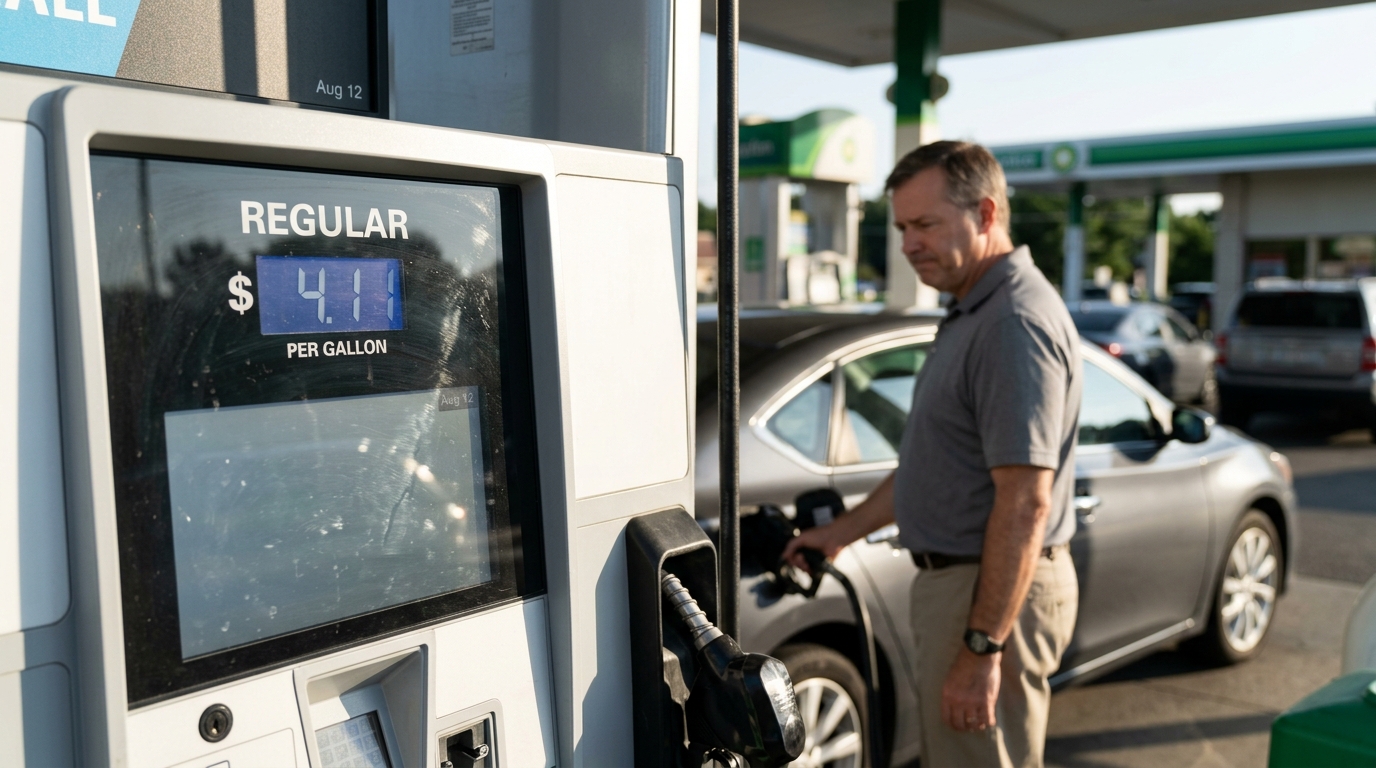
July CPI came in at 3.4% year over year, one tick below June. Monthly headline was 0.1%. Mild enough that AI infrastructure names rallied and near-term rate expectations calmed. Thursday brings PPI and initial jobless claims. Neither is likely to be the session’s primary driver. The primary driver, for active traders focused on energy, is a number posted at every intersection in America: $4.03 per gallon for regular gasoline, the highest August reading in the history of AAA daily national averages.
Why VLO Is in Focus Right Now
Valero Energy hit an all-time high of $324.37 on August 11, 2026. Two days later the stock is trading near $330, up roughly 99% year to date. That is not a story about momentum chasing. It is a story about the largest independent refiner in the United States operating in one of the widest margin environments in the industry’s history, at a moment when the catalyst driving that environment shows no sign of reversing.
The WTI 3-2-1 crack spread, the benchmark measure of refining profitability, recently reached approximately $59 per barrel. Since January 2026, refining margins have nearly tripled. The 2010-to-2021 historical average sat between $10 and $16 per barrel. The current level is not a cyclical blip. It reflects the simultaneous disruption of two major supply sources: Russian refinery capacity knocked offline by Ukrainian drone strikes, and Hormuz transit flows suppressed by IRGC interdiction since late February. Those two forces are compressing global product supply at a moment when U.S. gasoline inventories are running below seasonal norms.
Valero reported Q2 2026 net income of $3.7 billion, or $12.62 per diluted share, against $714 million a year earlier. Adjusted EPS of $12.54 beat consensus by 25%. Revenue came in at $44.5 billion versus a $37.95 billion estimate. Refining operating income hit $4.5 billion, up from $1.3 billion a year ago. Management guided for Q3 margins to be stronger than Q2. The next earnings release is October 22. That is the anchor for the trade’s time horizon.
Analysts have responded. TD Cowen raised their target to $350 from $338. Wells Fargo went to $356 from $292. Barclays moved to $323 from $279 with an Overweight rating. UBS lifted to $355 from $280. The consensus across 20 analysts sits at a Buy rating with an average price target near $310, already behind the current price. The outlier targets in the $350 to $356 range represent the scenario where Q3 delivers on management’s stronger-than-Q2 guidance.
Technical Picture
VLO’s chart structure entering this week was clean. From mid-July lows near $236 through early August, the stock built a series of higher lows that accelerated into the high $280s and $290s by July 13, then continued higher through the Q2 report on July 30. The all-time high of $324.37, set Monday, came on a session where the energy sector broadly gained 3.5% and VLO added 5.32%, outperforming sector peers ExxonMobil and Chevron.
Key technical levels to monitor over the next one to five sessions:
- All-time high / breakout level: $324.37. Monday’s print. A confirmed daily close above this level on above-average volume is the primary continuation signal. Failing to reclaim it after Thursday’s open would be the first sign of supply at the highs.
- Pivot support: $307.37. The most recent pivot level identified by options-based analysis. This is the first meaningful pullback zone. A hold here on any intraday dip keeps the trend intact.
- First resistance above: $320.53 (pivot R1). Clearing this level on volume opens the path toward the analyst high targets in the $350 to $356 range.
- 50-day simple moving average: approximately $258. Far below current prices. The distance between price and the 50-day SMA confirms the strength of the trend but also signals the stock is extended. Mean-reversion risk is real if the catalyst deteriorates.
- 200-day simple moving average: approximately $211. The long-term trend anchor. Price above the 200-day by more than 50% is an extreme reading that historically precedes either a sharp correction or a prolonged consolidation before continuation.
- MACD: positive at approximately 13.44. Momentum is trending higher, consistent with the bull move. Watch for any MACD crossover to the downside as a first warning signal.
- Volume: The move on August 10 and 11 came with elevated sector volume, with VLO ranking as the third-highest turnover stock in fossil fuel energy behind XOM and CVX. Sustained volume confirmation on any breakout above $324.37 is the key quality check.
VLO is trading near the top of its 52-week range and above its 200-day simple moving average, a configuration that favors trend continuation over near-term mean reversion, provided volume and sector support remain in place. The market capitalization stands at approximately $93 billion after the week’s move.
The Catalyst
Two catalysts are driving this trade, and they work on different timescales.
The near-term catalyst is the gas price record itself. The AAA national average has never been above $4 per gallon after August 12 in any prior year of recorded daily data. GasBuddy’s Patrick De Haan confirmed this on August 12. The EIA’s weekly report put the figure at $4.006 per gallon for the week ending August 10, down 7.3 cents from the prior week but up 88.8 cents from a year ago. California is paying $5.43. Texas $3.51. The national average peaked at $4.55 during the week of May 21 and has only partially retreated. This is a live news story that generates sustained financial media coverage, and that coverage keeps institutional attention on refining equities into the October earnings date.
The structural catalyst is the crack spread. At $59 per barrel, the WTI 3-2-1 spread is in territory it historically reaches only during acute supply dislocations. The conditions sustaining it are not resolved: Hormuz transits rose briefly to 84 vessels in the week of July 27 before the U.S. military fired on a vessel crossing the Gulf of Oman on August 12, and WTI moved back toward $84 while Brent held near $88. Russian fuel export restrictions on gasoline remain extended into 2027. Ukrainian drone strikes on Russian refinery infrastructure are an ongoing variable. None of these are headline risks that resolve with a single diplomatic announcement.
Valero’s internal catalyst is the $230 million St. Charles FCC Unit optimization project, on track to begin operations in Q3 2026. That project adds incremental high-value throughput capacity at one of Valero’s Gulf Coast flagship facilities. If it comes online as scheduled, it should be visible in the Q3 operating income line on October 22. That is the earnings call that either validates or disrupts the current price structure.
One Shark Missed Billions… Another Saw This Coming
Mark Cuban passed on Uber at a $10M valuation only to watch it go public at $80B.
Kevin Harrington, one of the original shark tank investors, invested early in Mode Mobile.
Like Uber turned vehicles into income-generating assets, Mode is turning smartphones into income streams. Deloitte named Mode the #1 fastest-growing software company.
Last chance to invest at $0.52/share. Price changes 8/14.
Please read the offering circular at invest.modemobile.com. This is a paid advertisement for Mode Mobile’s Regulation A+ Offering.
Risk Assessment
The risks here are real and move fast. Geopolitical premiums have a history of vanishing overnight. WTI dropped sharply from its earlier 2026 highs on multiple occasions when diplomatic signals emerged from the Hormuz situation, even when those signals proved temporary. A trade that depends on a supply disruption continuing has a binary failure mode that technical levels alone cannot protect against.
Specific risks to monitor over the next one to five sessions:
- Hormuz normalization signal: Any credible diplomatic development that raises the probability of sustained transit recovery would compress crack spreads within 24 to 48 hours. This is the primary invalidation risk for the bull case. Watch shipping and energy-market reporting for Hormuz vessel count updates. Transits sustained above 50 per day for two consecutive weeks would be the first meaningful signal of normalization.
- Crack spread compression below $45/barrel: The current level of $59 provides meaningful cushion. A compression below $45 signals margin deterioration is underway. Below $35, the structural thesis breaks down.
- Overbought technical conditions: VLO is up 99% year to date and just set an all-time high. The RSI was reading approximately 72 as of mid-July analysis, a level that flags near-term overbought conditions. A stock this extended can retrace 10% to 15% without breaking its long-term trend, but that is still a significant near-term move in the wrong direction for a new position.
- Demand destruction at the pump: $4-plus gasoline for more than 100 consecutive days in 2026 is the highest sustained $4-day count since 2022. If consumer demand destruction accelerates faster than supply normalizes, crack spreads compress from both ends simultaneously. Watch the EIA weekly implied demand figures for early evidence of this dynamic.
- July CPI gasoline trend reversal: Gasoline fell 2.9% month over month in July. If that trend reverses in August and the monthly CPI gasoline subindex turns sharply positive again, Fed commentary gets more hawkish and rate-sensitive equity positioning shifts. Higher-for-longer rates are generally not a tailwind for capital-intensive refining businesses.
- St. Charles FCC delay: Any announcement of a delay to the Q3 completion target removes a near-term fundamental catalyst and could create a sell-the-news reaction into the October 22 earnings date.
Scenario Framework
Bull Case: Hormuz transits remain suppressed. The partial diplomatic openings in July and early August collapse again, as they have at least three times since February. Crack spreads hold in the $50 to $60 range through September. The St. Charles FCC project comes online on schedule. Management delivers Q3 margins stronger than Q2 on October 22, as guided. VLO tests the $350 to $356 analyst target range in the weeks before and after the earnings release. The position entered near the $307 pivot support level, if a pullback materializes this week, produces a 15% to 20% return by the October catalyst.
Base Case: Partial diplomatic progress on Hormuz by October allows crude flows to partially normalize. Gasoline retreats toward $3.60 to $3.70 by November. Crack spreads compress from current extremes but hold well above 2024 levels. Refiners deliver strong Q3 results and guide conservatively for Q4. VLO consolidates in the $290 to $325 range through the October earnings date, then re-rates modestly higher or lower depending on Q3 margin delivery. Year-to-date gains are partially given back but the stock remains well above pre-crisis levels.
Bear Case: A credible Hormuz resolution combined with OPEC supply restoration and weakening U.S. consumer demand collapses crack spreads toward $20 to $25 per barrel within 60 days. That range represents 2023-to-2024 normalized levels. A stock up 99% year to date has meaningful drawdown exposure if the margin environment that justified the move reverses quickly. Names that gained 80% or more year to date, including MPC and HF Sinclair alongside VLO, face the steepest corrections when the trade unwinds. A position entered near the all-time high with no defined stop is the highest-risk way to be in this name heading into a binary Hormuz catalyst.
Active Trader Strategy Framework
The trade idea is not to chase VLO at the all-time high. The idea is to define the conditions under which adding exposure makes sense over the next one to five sessions, and to know precisely what would change the thesis.
Entry framework: The most structurally sound entry level, given current price action, is a pullback toward the $307 pivot support zone. That level represents a roughly 7% retracement from the all-time high, which is within normal range for a stock running this hot. A confirmed bounce off $307 on above-average volume, combined with crack spreads holding above $50, is the clearest entry signal available over the next several sessions. Do not initiate a full position on a gap open into new all-time highs.
Position sizing and scaling: Given the binary nature of the Hormuz catalyst, position sizing should reflect the possibility that the thesis invalidates rapidly. A two-thirds initial position, with the final third held in reserve until crack spreads confirm continued strength and/or VLO consolidates constructively above $307 for at least two sessions, is the appropriate structure. Full-size positions entered at all-time highs in geopolitically dependent trades have a poor historical track record.
Stop framework: A daily close below $290 would represent a break of the most recent consolidation structure and signal that larger-scale profit-taking is underway. That level is approximately 12% below the all-time high. For traders with a shorter time horizon of one to three sessions, a close below $307 constitutes the initial stop signal. The stop is not a prediction. It is the price at which the technical thesis no longer holds and continued exposure lacks a defined risk boundary.
Relative positioning across the refining group: VLO is the highest-beta pure refining play among the large-cap names. For traders who want refining exposure with a lower correlation to crack-spread volatility, Marathon Petroleum benefits from its MPLX midstream fee income, which holds up regardless of what crack spreads do. Phillips 66 adds midstream and chemicals exposure that softens the pure-refining beta. Both reported strong Q2 results: PSX’s adjusted EPS of $9.41 beat the $7.02 consensus estimate by 34%, and PSX expects buybacks to increase in H2 2026. For an active trader, VLO is the highest-conviction expression of a continued crack-spread environment. PSX is the appropriate hedge if normalization risk is the primary concern.
Volatility context: With VIX at 14.76, options pricing is not reflecting significant hedging demand. That makes defined-risk structures like call spreads or collars relatively inexpensive for traders who want to manage the binary Hormuz risk. The cost of buying downside protection is low. Consider whether a collar above the all-time high and below the $290 stop level is appropriate for longer-horizon holders with large gains already on the books.
Trader’s Checklist
Before acting, confirm the following over the next one to five trading sessions:
- VLO daily close vs. $307.37: This is the immediate pivot support. A hold above it on any intraday dip is the first sign of institutional support. A close below it on elevated volume is the first caution signal for new longs.
- VLO vs. all-time high of $324.37: A confirmed close above the August 11 high on volume at or above the 10-day average is the primary breakout confirmation signal. This is the entry trigger for traders who prefer buying confirmed strength over anticipating support.
- WTI 3-2-1 crack spread, daily: Monitor for any move below $50 per barrel. The current level of $59 is the margin environment that justifies the valuation. Compression toward $45 changes the calculus for Q3 guidance and the October 22 earnings call.
- Hormuz transit count: Any reporting of sustained transit recovery above 50 vessels per day for two consecutive weeks is the leading indicator of normalization. This is the catalyst that could invalidate the bull case faster than any technical level.
- EIA weekly petroleum report, Wednesday August 19: Gasoline and distillate inventory levels relative to the five-year seasonal range. A build toward normal levels removes one of the key fundamental pillars supporting elevated crack spreads.
- Energy sector relative strength: On August 10, the fossil fuel energy sector gained 3.5%, with VLO among the top performers. If energy sector-wide momentum fades while VLO holds, that is a sign of stock-specific strength. If VLO fades in line with sector weakness, the trade is macro-driven and more vulnerable to a Hormuz headline reversal.
- VLO Q3 earnings date confirmation: October 22, 2026. Position sizing and time horizon decisions should be made with this date as the anchor. The October 22 print is where management either confirms stronger-than-Q2 margins or revises guidance lower. Everything between now and then is positioning for that event.
- PPI and jobless claims, August 13: Thursday’s data releases are the immediate macro backdrop. A hot PPI reading could shift Fed expectations and dampen risk appetite broadly, creating short-term headwinds for any equity position including VLO. Weak jobless claims reinforce the demand side of the bull case for fuel consumption.
Bottom Line
VLO set an all-time high two days ago. The market that produced that high, $59 crack spreads, record mid-August gas prices, and a structural refining capacity shortage, has not resolved. The October 22 earnings date is 70 days out. Management guided for Q3 margins stronger than Q2. The St. Charles FCC project is on schedule to add throughput before that date arrives.
The trade for active traders over the next one to five sessions is not about buying the headline. It is about defining the levels, the catalysts, and the conditions that either confirm the continuation or signal the exit. The $307 pivot support, the $324.37 all-time high, the crack spread at $59, and the Hormuz transit count are the four numbers that matter. When two of those four turn against the thesis, the position size belongs in the reduce column, not the add column.
Preparation over prediction. Know the levels before the session opens.
For informational and educational purposes only. Not investment advice. Trading involves risk, including loss of principal.