
September 7, 2026
Bonus Content: No Fed Cut Until 2027. Here’s What That Costs Your Book Now.
Hey. It’s Alex Reid.
And I just held what could be arguably the most important event in my entire career…
In this event, I revealed Oracle…
A brand-new, first-of-its-kind breakthrough that helps us track the massive, sneaky bets of insiders right in the predictions market…
And reveals the stocks and options set to benefit the most!
The team and I worked long hours for months to put Oracle together…
We even ran beta tests for weeks, and the results were amazing!
I’m talking about 39% on USO in 4 days…

43% on PLTR in a day…

And 67% on WEN in 2 days…
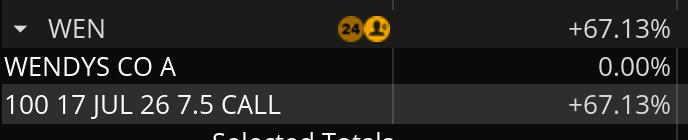
All with a regular brokerage account.
Of course there were smaller winners and those that didn’t work and we won’t be making reckless promises when it comes to trading…
But I gave anyone who joined the live event the chance to secure FREE access to Oracle!
And in the next few minutes…
You too can secure access at no cost!
Look…
Insiders are using the predictions market to hide their huge, sneaky bets at an insane rate.
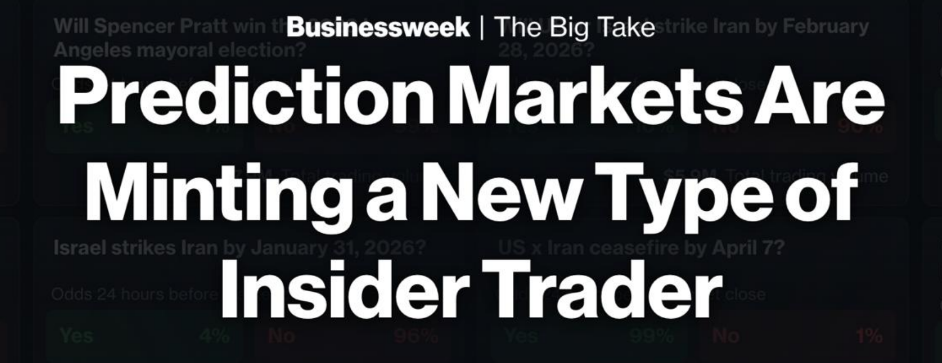
The question is will you let this opportunity pass you by?
If you’d like to get a deep dive into how Oracle tracks these massive insider bets…
And secure access completely on the house…
To Better Trading,
Alex Reid
No Fed Cut Until 2027. Here’s What That Costs Your Book Now.

The Street spent most of 2026 arguing about timing. After Friday’s jobs report, it is arguing about direction. Citigroup, one of Wall Street’s more consistently dovish houses on Fed policy, scrapped its 2026 cut calls on September 4 and moved its first 25-basis-point reduction to June 2027, with two follow-on moves in September and December of that year. That is a material delay from where its forecast sat two weeks ago.
The trigger was a labor market reading that was nearly three times the consensus estimate. Nonfarm payrolls increased by +162K in August, compared with a consensus estimate in the mid-50Ks, and Treasury yields climbed sharply as traders shifted the implied Fed path. Upward revisions also added 55K to June and July combined, signaling firmer hiring momentum. The unemployment rate remained at 4.1% while labor force participation edged up to 61.6%.
The Macro Environment
The Federal Reserve left the federal funds rate unchanged at 3.50%–3.75% in July 2026 for a fifth consecutive meeting, despite markets assigning roughly a one-in-three probability to a rate hike at that meeting. That hold now looks like the last quiet moment for a while. The Fed’s preferred inflation gauge, the PCE price index, stood at 3.7% year-over-year in July 2026; core PCE held at 3.3%. Both figures remain well above the 2% target.
Market pricing has shifted meaningfully toward a September move, but the precise probability has moved around day to day. As of September 4, CME FedWatch-type pricing implied roughly 60% odds of a 25-basis-point hike at the Fed’s September 15-16 meeting, up from roughly 50% the day before. The FOMC blackout period began September 5, so officials will not comment publicly ahead of the decision. The August CPI release on September 11 falls just five days before the FOMC rate decision, making it the final major inflation reading before the Fed announces its policy choice.
As of September 4, Cleveland Fed Inflation Nowcasting showed headline CPI tracking at 3.43% year-over-year and 0.38% month-over-month for August; core CPI was tracking at 2.32% annually and 0.19% sequentially. A reading that confirms or exceeds those levels will be difficult for the three July dissenters, who already wanted to hike, to dismiss.
Sector Breakdown: Where Higher-for-Longer Lands First
Citi has been among the relatively dovish voices on the Fed; when the house that argued for early easing moves its own first-cut call out by more than a year, rate-sensitive positioning across equities has little choice but to adjust. That adjustment is not uniform across the market.
Small caps (IWM) carry disproportionate floating-rate debt exposure. Refinancing costs compress margins in a 3.50%–3.75% funds rate environment; strip away the relief valve of near-term cuts and the earnings pressure compounds. Real estate and REIT exposures remain among the most rate-sensitive expressions, with performance in the second half of 2026 still highly dependent on upcoming rate decisions.
Utilities (XLU) sit at an 18-19x forward P/E range in many valuation snapshots, a multiple that is hard to defend if the long end of the curve steepens further on a hike.
Financials (XLF) are the sector-level counterweight. Net interest margin widens when the front end rises and the curve is not inverted. Banks with significant floating-rate loan books benefit directly from any September hike. That divergence, XLF versus IWM and XLU, is one of the cleaner relative-value expressions of the current positioning.
Technical Framework
TLT (20+ year Treasury ETF) faces continued structural pressure. Each payroll beat pins long-end yields higher and compresses duration values. Traders watching TLT should monitor the 200-day moving average as the first meaningful support level; a decisive break lower would confirm the bear case for fixed income and amplify the pain in XLU and mortgage REITs. SHY (1-3 year Treasuries) is the more surgical instrument: it responds most directly to the September 16 decision and to Friday’s CPI. Volume concentration around key resistance on SHY ahead of September 11 will telegraph whether institutional desks are repositioning in size before the blackout period ends.
Scenario Modeling
Bull Case: August CPI prints soft (core below 0.15% month-over-month), hike odds collapse back toward 35-40%, and SPY recovers the prior week’s payrolls-driven losses. IWM stabilizes above its 50-day moving average. Citi’s June 2027 call remains intact but the market stops pricing further hikes beyond September. TLT retraces toward resistance.
Base Case: CPI lands near the nowcast (core 0.19% MoM, headline ~3.4% YoY). The Fed hikes 25 basis points on September 16, declares data dependency, and offers no forward guidance. This is not seen as the start of an aggressive tightening cycle but rather as a measured move aimed at reinforcing the Fed’s inflation-fighting credibility. XLU and REIT ETFs remain under pressure through year-end. XLF holds relative strength.
Bear Case: CPI surprises to the upside (core above 0.25% MoM). Market rapidly prices a second hike in November. IWM breaks multi-month support levels, REIT valuations face a material reset, and TLT sets new cycle lows. The 2027 Citi cut calls get pushed further out. SPY tests its 200-day moving average.
Active Trader Strategy Framework
The September 11 CPI reading is the single highest-priority catalyst between now and the FOMC decision. Position sizing ahead of that release should reflect the binary risk. For traders watching IWM, the key level is whether it holds support or fails on a hot inflation reading; a break lower with volume would confirm institutional de-risking. On TLT, the bond market remains highly sensitive to employment and inflation data; options strategies that account for sharp swings ahead of Friday’s CPI can help manage portfolio risk around the event.
The macro picture does not reward passive positioning this week. With the FOMC in its blackout period, no Fed speaker can walk back hawkish market pricing before September 16. Every data point between now and then is unfiltered.
Conclusion
When one of the Street’s more persistent doves abandons its entire 2026 easing outlook in a single note, the signal is worth taking seriously. The question is no longer whether cuts are coming this year. It is whether the next move is a hike. Preparation means knowing your levels on IWM, XLU, and TLT before 8:30 AM Friday, sizing risk accordingly, and resisting the urge to front-run the CPI with conviction before the data confirms the direction.