September 12, 2026
Bonus Content: The Fed Hikes Wednesday. Here Is What It Costs the S&P 500.
In the 1849 gold rush, most prospectors went home broke. The fortunes went to the people selling picks, shovels, and denim to everyone doing the digging.
The AI gold rush is running the same script. The money is piling into chips. But a chip is a paperweight until you plug it in, and the plug is where the real shortage is.
The United States must more than triple its annual power capacity, from 25 gigawatts of data center demand in 2024 to more than 80 gigawatts by 2030.
American PowerGen is already assembling that infrastructure: a 22 gigawatt pipeline across 16 projects in Texas, where large new electricity users have already requested more than 430 gigawatts of new power. That’s nearly 5x the state’s current peak capacity. Land secured. Gas supply arranged. ERCOT interconnection studies completed. Air permits submitted. 3 gigawatts of construction is set to start in 2027.
Nasdaq ticker “APGX” reserved. Shares are $2.50 per share at a $27 million pre-money valuation, with up to 17% bonus shares for early investors.
Minimum investment: $1,000.
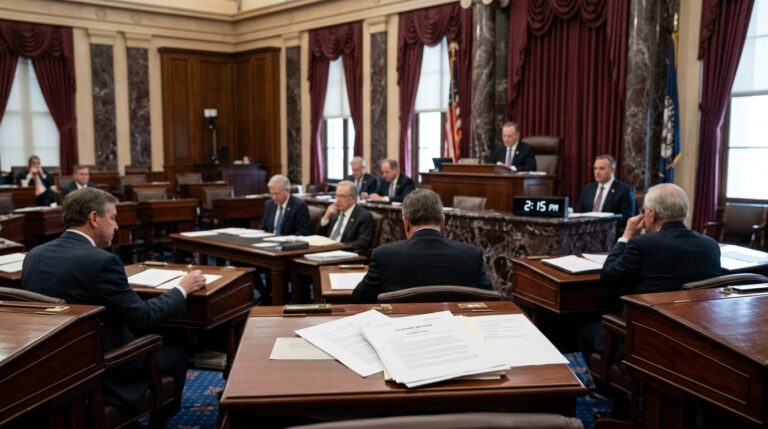
The Fed Hikes Wednesday. Here Is What It Costs the S&P 500.
Friday’s August CPI reading ended the debate. Consumer prices rose 3.4% year over year, with monthly inflation accelerating to 0.4% from 0.1% in July. The number that moved markets was core: core CPI eased to 2.4% annually but jumped 0.3% month over month, hotter than the 0.2% consensus. Within minutes of the release, the probability of a Fed rate hike next week jumped to around 85% to 90%, from roughly 70% to 72% beforehand.
A move Wednesday would be the first rate hike since July 2023. It would also be the first of Kevin Warsh’s chairmanship. Warsh held rates steady in his debut FOMC meeting but delivered a sharply hawkish surprise, with nine of 18 participants projecting at least one 2026 rate hike and the statement stripping out its easing bias. That June signal has now been followed by the data. Capital Economics chief North America economist Stephen Brown put it plainly in a recent note: the inflation data keeps the Fed leaning toward a hike, even if it does not pull the trigger immediately.
The Rate and Yield Framework
A 25-basis-point move takes the funds rate to 3.75%-4.00%. The long end of the curve has been pricing that direction for weeks. The 10-year Treasury closed at 4.95% on September 10, up 12 basis points on the day. Friday’s CPI held the 10-year near 4.9% as oil pulled back slightly, but the structural drift is higher. The average 30-year fixed mortgage rate is still below 7% on the Freddie Mac weekly survey, but some daily rate measures have moved back above 7% as Treasury yields climbed.
The dot plot arriving Wednesday is equally important. Warsh’s decision against submitting a dot projection at the June meeting drew attention, particularly as the Fed’s June SEP pointed to a higher policy-rate path than officials had anticipated in March. Odds for a follow-on hike in October have risen materially since Friday’s data, which means the September SEP could still embed a terminal rate at or above 4.00% into institutional models.
Sector Divergence Is Already Visible
Not every corner of the S&P is sitting at equal risk. Most S&P sectors are higher year-to-date, but energy is not up 43% year-to-date. Energy has been structurally priced for a higher-rate, higher-inflation environment driven by the Iran war. Diesel hit a record national average of about $6.06 a gallon on Friday, up more than 60% from $3.71 a year ago according to AAA. Refiners have felt that directly, with several names notching fresh highs.
Utilities tell the opposite story. Steadily climbing Treasury yields and the potential rate hike are threatening more instability for utilities, which surged more than 11% through late February but are now closer to flat year-to-date. Utilities carry higher financing needs due to capital-intensive infrastructure, making them acutely sensitive to the cost of capital for long-term investments.
Technology is the position with the most embedded assumption to validate. The S&P 500 dropped below its 50-day moving average Thursday for the first time since late July, and the chip-dominated Nasdaq-100 followed. AI capital expenditure programs, with some research estimating a $1.5 trillion external financing gap for the buildout, face direct pressure from a higher funds rate.
Technical Framework
The SPX is flirting with its 50-day moving average, and a sustained break below that level could accelerate selling. The 10-year yield has climbed from below 4.65% in mid-August to current levels near 4.9% to 5.0%. The prior all-time high near 7,800 now acts as overhead resistance. Support from the September 4 close at 7,718 is the first level to monitor; a break opens a path toward the August consolidation zone near 7,550.
Scenario Modeling
Bull Case: The Fed hikes 25 basis points, the dot plot reveals no additional hikes penciled in for 2026, and Warsh strikes a data-dependent tone in the press conference. The 10-year retreats toward 4.65%, equities stabilize at 7,600-7,700, and energy continues to lead while rate-sensitive sectors recover partially.
Base Case: The 25-basis-point hike delivers as priced. The SEP embeds one additional potential hike, the 10-year stabilizes near 4.90%-5.00%, and the SPX consolidates in the 7,400-7,700 range through month-end. Rotation continues from growth toward energy and select financials that benefit from wider net interest margins.
Bear Case: The hike arrives alongside a dot plot signaling further moves, Warsh signals data will determine the pace, and October odds move toward 70%. The 10-year pierces 5.10%. The SPX breaks below the 50-day moving average with conviction, triggering programmatic selling toward the 7,200-7,300 zone. Consumer discretionary and high-multiple technology names face the sharpest adjustment.
Active Trader Strategy Framework
The asymmetry this week sits in the press conference, not the hike itself. A 25-basis-point move is largely priced. What is not fully priced is Warsh’s forward language and whether he submits a dot. Monitor the 10-year at 5.00% as a structural decision line for equity positioning. Volatility compression before Wednesday likely reflects dealers hedging, not conviction. Size accordingly. Traders long energy through the macro leg should identify levels at which geopolitical premium begins to fade, because that is where the trade ends regardless of what the Fed does.
Preparation is the only durable edge into a live FOMC meeting. Wednesday delivers the first genuine policy tightening in over three years, a fresh SEP, and a chairman who has yet to be stress-tested by a market moving against him. Position sizes, stop levels, and scenario frameworks belong on the desk before Tuesday’s close, not after the statement drops.