Dear Reader,
A close contact of ours – a deeply connected venture capitalist with insights from the Pentagon and Silicon Valley – just went live with a confidential presentation…
Depending on when you’re reading this, it might already be too late to claim your spot in what could be one of the biggest pre-IPO plays of our time.
In this video briefing, you’ll learn how everyday investors can get pre-IPO exposure to this $30 billion juggernaut…
And you can do it straight from a regular brokerage account… with right around twenty bucks!
All you need is the four-letter ticker symbol… revealed in this video.
But here’s the thing: getting in pre-IPO is where the biggest gains happen.
So if you want to position yourself before this potential blockbuster IPO hits Wall Street…
Click here now to watch the urgent briefing… and get the pre-IPO ticker symbol.
Regards,
Addison Wiggin
Founder, Grey Swan Investment Fraternity
P.S. You will get the ticker symbol completely free in this briefing. No strings attached!
Crude Oil Falls Five Days Straight. Here Is What the Iran Diplomacy Means for Energy vs. Airlines
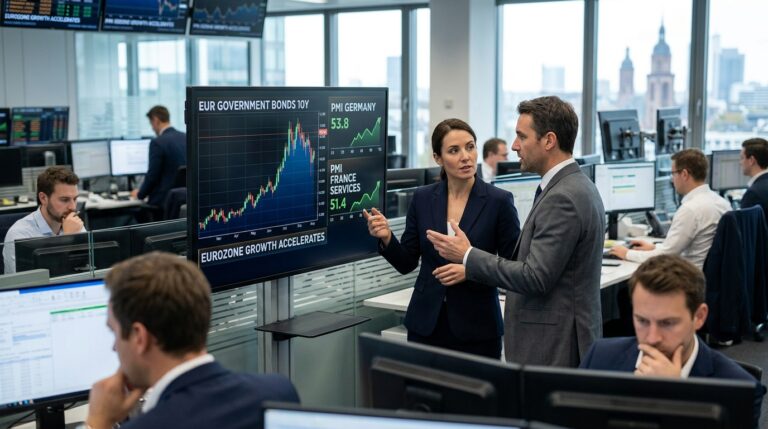
Five consecutive losing sessions. That is the streak crude oil carried into Wednesday, driven by a diplomatic signal out of New York: indirect U.S.-Iran contacts on the sidelines of UNGA and headlines suggesting Tehran could be willing to facilitate a return toward more normal commercial shipping through the Strait of Hormuz if Washington eases pressure. Specific terms such as a seven-day reopening window and claims about a “blockade on Iranian ports” have not been confirmed in public by U.S. officials, and key details have been carried in fragmented, sometimes conflicting reporting. That distinction matters enormously for positioning.
Bullet Summary
- WTI settled Tuesday at $90.52, down $1.85 on the session; Asian trade Wednesday extended losses, with WTI trading near $89.00 to $89.50, a more than two-week low.
- Brent briefly broke below $98/bbl on Tuesday before steadying back near $100.
- The 10-year Treasury yield was roughly 4.96% on Tuesday, near recent highs, as markets balanced a softer oil impulse against a tighter Fed path.
- Iran said about 50% of damaged South Pars capacity was back online as of September 22, up from roughly 40% in late August.
- AAL, DAL, and UAL each gained more than 2% on Monday’s crude pullback; LUV added 1.7%; the relief trade in airlines is real but structurally uneven.
- Trump described the UNGA-side talks with Iran’s delegation as “a very good” meeting, while separately telling the General Assembly he faced a choice between a deal and force.
- WTI’s 52-week range spans $54.98 to $117.63, highlighting the scale of optionality still priced into energy equities.
Market Context
The macro backdrop heading into Wednesday’s session is defined by two competing forces: genuine de-escalation signals from Tehran and a Federal Reserve that is not done tightening. The 10-year yield around 4.96% sits just below the psychologically significant 5% level that rattled equity markets earlier this month, after the Fed’s September 16 rate hike. St. Louis Fed President Alberto Musalem flagged that further increases may be needed, while markets continue to price the risk of at least one additional hike before year-end. That rate environment compresses the valuation multiple available to high-debt energy producers and still-leveraged airline balance sheets alike.
On the supply side, the picture is shifting fast. Saudi crude flows through the Strait of Hormuz averaged roughly 2.9 million barrels per day over the six days ending September 18, up sharply from around 700,000 barrels per day in August, according to JPMorgan analysts cited in market reporting. South Pars, the field that accounts for around one-third of the world’s largest natural gas reservoir, is now about 50% restored after Israeli strikes in March damaged facilities and reduced output.
Sector Breakdown: Energy vs. Airlines
The energy-versus-airline rotation is the clearest expression of the Hormuz trade. XOM closed September 21 at $158.30, down 3.2% on the session, as crude retreated and supply route fears eased. Analyst consensus targets cluster around the high-$160s to low-$170s for XOM, implying modest upside even after a strong year-to-date run driven by the crisis premium. CVX carries consensus in the low-$200s, with a recent early-September note from BMO raising its target to $235 (not $243). OXY, with high revenue sensitivity to spot crude among the three, requires the most caution in a diplomatically driven sell-off: it has been a year-to-date leader in the group, meaning it carries the most to give back.
Airlines are the mirror trade. Jet fuel is roughly 20-25% of operating costs across the sector. AAL’s Q2 fuel bill reached $4.9 billion against pretax income of $107 million, making it a highly leveraged name to crude direction. DAL holds structural advantages: its Monroe Energy refinery can turn crack-spread widening from a threat into a partial offset, and Delta has guided to multi-billion-dollar annual free cash flow, with filings and company materials pointing to roughly $3.8 billion of free cash flow in fiscal 2025 and company commentary indicating a higher figure under its adjusted definition. LUV’s cash generation profile has been more constrained, and sustained high fuel costs remain a genuine concern. AAL carries about $35.73 billion in total debt with a near-flat net margin.
Technical Framework
WTI is testing key levels. The 38.2% Fibonacci retracement sits at $91.23, which now acts as the first resistance on any bounce. A more robust ceiling forms near $95.37 at the 23.6% retracement, with the cycle high around $102 as the far wall. Support clusters between $87.87 and $84.52. The five-session losing streak has pushed price below the 20-day moving average, and momentum indicators are negatively aligned. Volume on down days has been above average, which gives the bearish move credibility rather than labeling it a thin-market drift.
Scenario Modeling
Bull Case for Crude / Bear Case for Airlines: The Hormuz thaw fails to translate into operational throughput, and WTI recovers to $95-$102. Energy equities gap higher; airline stocks, already well off summer highs, re-test recent lows. The catalyst is any hostile action in the strait or a breakdown in UNGA-adjacent contacts.
Base Case: Talks continue inconclusively through this week’s UNGA window. WTI consolidates in the $87-$92 range, holding the current technical support zone. Airlines sustain the relief rally partially but face resistance as no formal deal is signed. DAL outperforms AAL and LUV given its structural balance sheet and refinery hedge.
Bear Case for Crude / Bull Case for Airlines: A formal framework emerges from UNGA contacts and physical flows normalize faster than expected, pushing WTI below $85 toward the $80 area. Airlines surge 5-10%, with the highest-beta, most-damaged names outperforming on short-covering. AAL and LUV, deeply discounted from summer highs, benefit disproportionately despite weaker fundamentals.
Active Trader Strategy Framework
The rotation between XOM/CVX and AAL/DAL/LUV is tradable but requires defined risk. Given that any concrete Hormuz “reopening” timeline and U.S. acceptance of specific conditions remain unverified in public, treating full de-escalation as priced-in is a risk management error. Monitor the $91.23 WTI level on any bounce as the first line of resistance; a close above it changes the short-term momentum structure. On the airline side, DAL’s structural advantages make it the more defensible long against crude weakness; AAL’s debt load and thin margins mean its upside in a deal scenario is greater but so is its downside if talks stall. Volatility remains elevated across both sectors, so position sizing relative to normal ranges warrants reduction. Watch for any formal U.S. statement about conditions and sequencing as the binary trigger.
Conclusion
Preparation, not prediction, is what the current environment demands. The diplomatic window is real, the supply data is shifting constructively, and the sector rotation between energy and transportation is expressing it in real time. But unconfirmed proposals relayed through mediators are not signed agreements. Disciplined traders define their levels before the next headline lands, not after.