October 7, 2026
Bonus Content: AMD Hits a Record $649. Citi Sees $800. Levels to Watch
They named him “Mr. 1,000%” for a reason:
Because he’s called 51 different stocks that have gone up 1,000% or more.
FIFTY ONE! It’s almost unbelievable.
One example is his call on NVDA back when it was $6…
Now, 6 years later, it’s up more than 3,100%.
He also wrote up every single “Magnificent 7” stock before that name was even a thing.
Look: can you imagine grabbing 51 different 10-baggers?
Even ONE 10-bagger can be lifechanging.
And “Mr. 1,000%” has called dozens and dozens over his career.
That’s why you need to see the details on his #1 AI stock for right now.
To your wealth,
Stephen Prior,
P.S. We’ve frantically worked behind the scenes for months to launch Mr. 1,000%’s new service. Here are the details…
AMD Hits a Record $649. Citi Sees $800. Levels to Watch
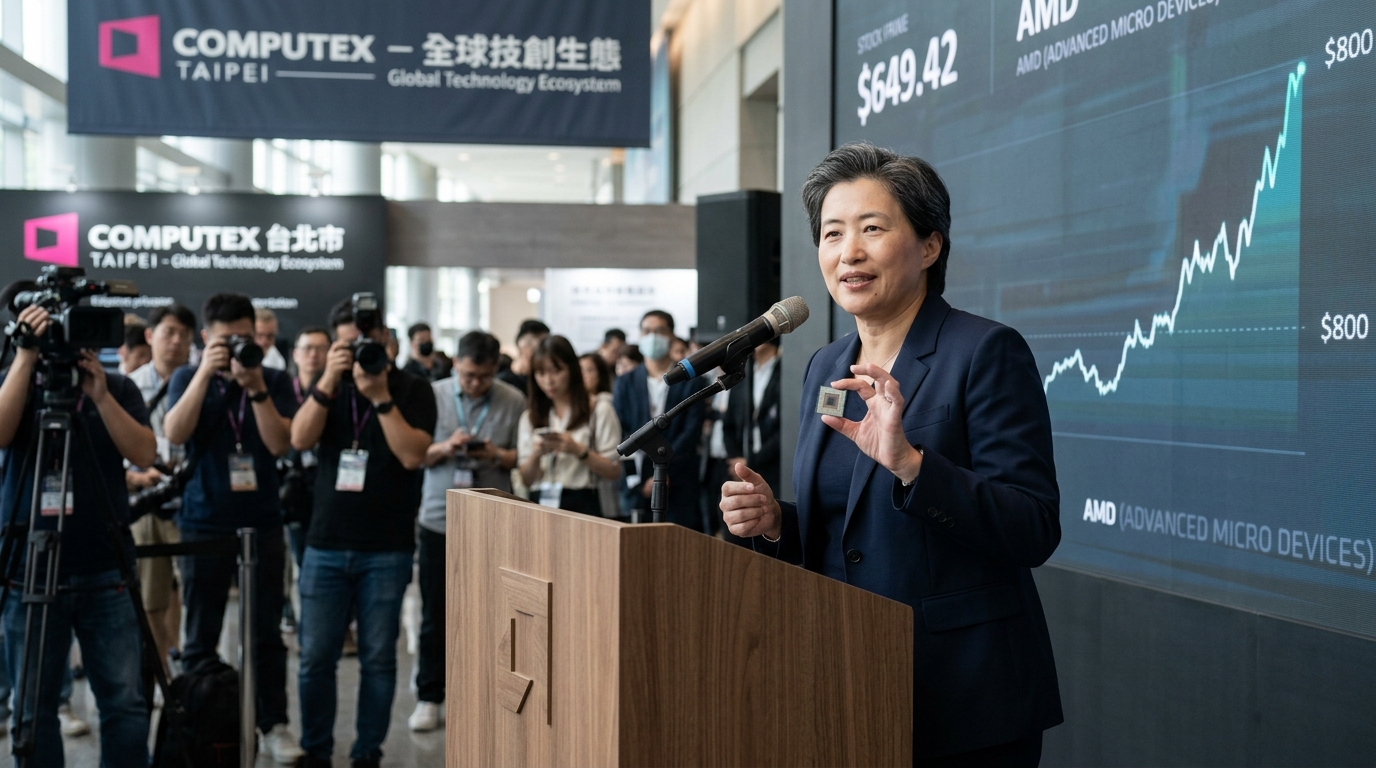
AMD closed at a record $649.42 on Tuesday, up 2.8%, after CEO Lisa Su told reporters in Taipei that the company would substantially increase chip supply in 2027 and Citigroup lifted its price target to $800 from $575. The gap between where the stock sits today and where Citi now thinks it belongs is about $151, or roughly 23%. The question active traders are pricing right now is whether the catalyst quality justifies that gap, or whether Tuesday’s close is where the easy money ran out.
- AMD closed at a record $649.42, up 2.8%, with an intraday high of $658.52, its 52-week peak.
- Citi analyst Atif Malik raised his AMD target to $800 from $575, a 39% increase, maintaining a Buy rating.
- Citi’s 2030 CPU total addressable market forecast moved to $300 billion from $237 billion, up from $29 billion in 2025, implying a 60% compound annual growth rate.
- Su said demand for CPUs is running ahead of supply, with AMD now planning capacity three to five years ahead.
- AMD’s Q2 2026 revenue reached $11.5 billion on 50% year-over-year growth; the stock has gained roughly 200% year-to-date from a January open near $214.
- Mizuho Securities separately raised its AMD target to $705 from $580, citing agentic AI demand.
- AMD’s market cap crossed $1 trillion amid the AI-driven rally, with a trailing price-to-earnings ratio near 167.
The Macro Context
Citi expects the CPU market to expand from $29 billion in 2025 to $300 billion by 2030. That is not a projection built on today’s workload mix. Agentic AI could require substantially more compute than traditional chatbots because the agents operate continuously and execute tasks in the background. Personal AI agents like Meta’s Muse and OpenAI’s Dots can keep running after a user closes the app, unlike chatbots that respond to queries. That shift in usage pattern is what Citi is monetizing in its model. It is also why the CPU story has diverged sharply from the GPU story this cycle: the bottleneck is spreading.
Su confirmed the pressure is real, saying demand is higher than supply of CPUs. Memory remains supply-constrained, including the high-bandwidth memory used in AI servers, while AMD also needs more advanced packaging capacity. That echoes a memory crunch that could last years, with Micron saying more than 75% of its 2027 output is already committed. TSMC is central to resolving the constraint. Su met with Foxconn and plans to meet TSMC as part of discussions with local partners.
The Financial Case
AMD will be the biggest beneficiary of a rebound in CPU demand, according to Citigroup, which noted that Meta is among AMD’s largest server customers, with Intel named as a secondary beneficiary. The numbers Citi is projecting for AMD specifically are aggressive. AMD projected second-half 2026 server CPU revenue to grow 80% year over year and 70% in 2027, with data center revenue expected to more than double in 2027 and AI GPU revenue growing well over 100%. Those are not steady-state growth rates. They require the supply ramp Su is now publicly committing to.
AMD’s Q2 2026 revenue reached a record $11.5 billion with 50% year-over-year growth. At a $649 close and a trailing P/E near 167, the market is clearly pricing the 2030 scenario, not the trailing twelve months. That compression of time creates the risk that matters most to traders today.
Technical Framework
On October 6, AMD traded between a low of $628 and a high of $658.52. The intraday high is now the 52-week high and a fresh all-time record. With $600 now seen as a key support level, momentum buyers who entered below $630 on the breakout have a clear reference point. The zone to watch on any continuation attempt is $658 to $700. A hold above $628 to $630, the prior session’s open, keeps the bull structure intact. A close below $600 would be the first structural warning for trend-followers.
The stock trades at a trailing P/E near 167. If RSI is holding in the low 70s, that would align with overbought conditions despite bullish analyst consensus. Momentum at these levels tends to follow through until it does not. The $658.52 intraday high is now the line that separates continuation from a two-sided range.
Three Scenarios
Bull Case
AMD sustains the $649 to $658 range as a base, draws institutional buying toward Citi’s $800 target, and the 2027 supply ramp is confirmed in the Q3 earnings call. A move above $660 on above-average volume opens a measured-move target toward $700 to $720.
Base Case
The stock consolidates between $620 and $658 for two to three weeks as the market digests a 200% year-to-date gain. Earnings guidance in late October becomes the next binary event. The bull thesis remains intact, but near-term upside is capped by valuation and overbought momentum indicators.
Bear Case
Profit-taking accelerates on any macro headwind or earnings-guidance miss. A break below $600 would signal that the Citi-driven surge was a sentiment event rather than a rerating. Structural support below that sits closer to $560 to $580, the pre-breakout consolidation zone from September.
Active Trader Framework
The asymmetry here is not obvious. A $150 gap to Citi’s target sounds compelling, but the stock has already priced a large portion of the 2030 market estimate. Traders adding exposure at current levels should size positions to accommodate a 10% to 15% drawdown without forcing an exit. Key levels: $658.52 as resistance, $628 as short-term support, $600 as structural defense. On the short side, a failed re-test of $658 with declining volume would be the framework for a mean-reversion position toward $620.
Su’s Taipei comments confirm the demand backdrop is genuine. The supply constraint is real, the CPU TAM revision is defensible, and the competitive positioning against NVDA in the data center CPU segment is strengthening. What is less clear is whether all of that is worth roughly 167 times trailing earnings today, before the 2027 ramp has delivered a single additional wafer. That is the question this week’s price action is answering in real time. Disciplined traders watch the levels and let the market provide the answer.