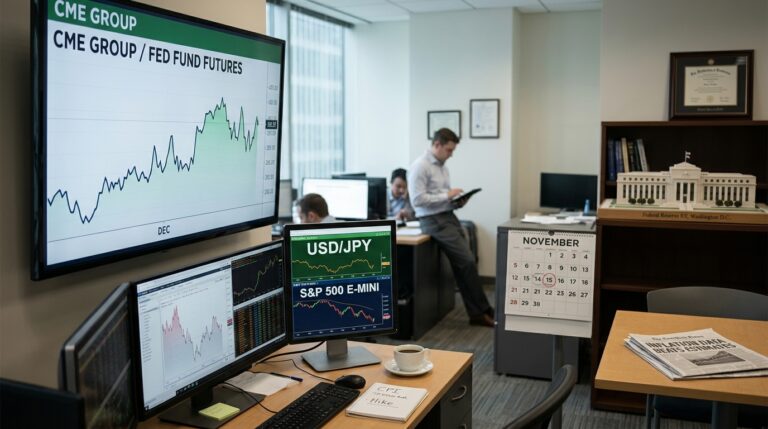

Editor’s Note: Hedge fund legend Larry Benedict, who delivered $274 million in profits to his hedge fund clients, says Washington sets the days billions could pour into the market months in advance… and the next one could come December 9. He’s revealing his ONE ticker for those days, FREE. Click here to see the details or read more below…
Dear Reader,
Grab this three-letter ticker before Wednesday, December 9.
Because Washington just triggered a rare wealth-building window…
Where billions of dollars could surge into the market about every 11 days…
Handing everyday Americans a shot at pocketing YEARS of gains in ONE trade.
And hedge fund legend Larry Benedict…
A man famous for going 20 straight years without a losing year…
Says December 9 is just one of more than 30 days like it over the next 12 months.
The best part is, every one of them is pre-determined.
Which makes this one of the most predictable and exciting opportunities he’s seen in decades…
Especially since the last time it opened, anyone who followed Larry’s trades…
Could have collected YEARS of market gains over and over again, like:
More than FIVE years in a week…
Almost SEVEN years in six days…
Even 17 YEARS of gains… in a matter of HOURS.
All around pre-determined days, just like December 9.
If you act now, you could have a chance to potentially pocket tens of thousands of dollars over the next 12 months.
In a new interview, he walks through his strategy step by step…
And names the ONE three-letter ticker he trades most on days like these.
It’s FREE to watch.
Regards,
Lauren Wingfield
Managing Editor, The Opportunistic Trader
P.S. The last time this wealth-building window opened, anyone who followed Larry Benedict’s trades could have made more than 57 YEARS of market gains in under 11 months. Click here to get his ONE ticker FREE before December 9.
SBLK Reports Q3 in Six Days. The Dividend Math Is the Trade.
Star Bulk Carriers reports Q3 2026 results after the close on November 18, six days from now. The stock sits at $28.32. The consensus analyst target is $31.50. That 12% gap closes or widens based on one number: how much of the current freight surge translated into declared cash.
The Rate Environment Doing the Work
Capesize spot earnings reached $36,936 per day this week, up $1,044 in a single session, as Pacific demand returned earlier than seasonal patterns typically allow. The Baltic Dry Index rose 1.8% to 2,854 on Monday, its highest reading since October 9. That matters directly for SBLK because the company’s fleet generated a time-charter equivalent rate of $24,486 per day in Q2, a figure that nearly doubled the year-ago quarter. If Q3 TCE held anywhere near that level, the earnings leverage is significant.
Global dry bulk trade is projected to expand 2.4% in tons and 3.8% in ton-miles for full-year 2026, supported by record grain volumes and recovering coal exports. That backdrop underpins the rate cycle, but it does not eliminate the downside: iron ore futures recently fell below $90 per ton, and any softening in Chinese steel demand would pressure capesize rates faster than other vessel classes.
The Payout Policy Is the Differentiator
Star Bulk’s full payout dividend policy converts rate strength directly into declared dividends, quarter by quarter. Q1 delivered $0.50 per share. Q2 delivered $0.90 per share. The company has returned over $2.15 billion to shareholders since 2021 through dividends and share buybacks. The balance sheet entering Q3 showed $565 million in cash against $1.04 billion in borrowings, with a debt-to-equity ratio of 0.32.
Analysts forecast Q3 EPS of $1.33 on revenue of $319.79 million. SBLK beat the Q2 consensus by 27% and the Q1 consensus by 37%. Two straight material beats set a high bar for a third, and a miss would likely compress the dividend sharply given the variable payout structure.
Variable payout structures create a specific kind of earnings risk: a dividend that looks generous one quarter can reset sharply the next. UPS shows how a high declared yield can mask a payout that has almost no margin for an earnings shortfall.
Technical Structure Ahead of the Print
SBLK trades in a $17.85 to $32.88 one-year range. At $28.32, the stock sits in the upper half of that band but roughly 14% below its annual high. Volume patterns through October were unremarkable, suggesting institutional positioning has not yet moved decisively ahead of the report. The 52-week midpoint is approximately $25.37, which now acts as a near-term support level.
Scenario Modeling
Bull Case: Q3 EPS clears $1.40, the dividend exceeds $1.00 per share, and management signals sustained Q4 capesize rates above $30,000 per day. SBLK tests the $32 to $33 analyst target range within two weeks of the report.
Base Case: EPS lands near consensus at $1.30 to $1.35, dividend is declared at $0.85 to $1.00. The stock holds $27 and drifts toward $29 on yield-seeking demand. A double-digit annualized dividend yield, based on recent payouts, keeps income buyers engaged.
Bear Case: Iron ore pressure and Q3 rate softness relative to Q2 produce an EPS miss below $1.10. A dividend cut below $0.60 triggers a rerating toward $22 to $23, where the stock traded in early 2026.
Active Trader Framework
The event risk is binary and six days out. Traders positioned long should identify $25.37 as the level to defend on a miss; a close below that figure would shift the technical structure from range-bound to distribution. On the upside, $29.50 is the first meaningful resistance before the $31.50 consensus target. Volatility around earnings in prior quarters has been asymmetric: the Q2 beat produced a sharp intraday move. Options pricing ahead of November 18 deserves attention given SBLK’s history of outperforming estimates by wide margins. Sizing relative to sector exposure in tankers and containers matters, as dry bulk is not correlated to those markets day-to-day. Preparation, not prediction, is what the next six days require.