September 8, 2026
Bonus Content: JPMorgan’s $829M Equity Underwriting Quarter Has a Catch
The AI Boom Is Creating A Copper Wake-Up Call

Critical metals are having a 2026 moment. And copper may be one of the biggest reasons why.
AI data centers need it. Power grids need it. Electrification needs it. So as demand rises, investors are starting to ask a much simpler question:
Where will the next supply come from?
In a world where critical mineral supply chains are getting more complicated, friendly copper stories are starting to matter more.
Future copper supply is not just about price. It is about location, access, permitting, funding, and whether a project can move forward in a world where new mines are getting harder to build.
That is where this small copper story comes in. It sits in one of North America’s most popular copper-gold regions. Plus, it has historical drilling and fresh exploration funding.
Copper is no longer just a commodity story. It is becoming a supply story.
JPMorgan’s $829M Equity Underwriting Quarter Has a Catch
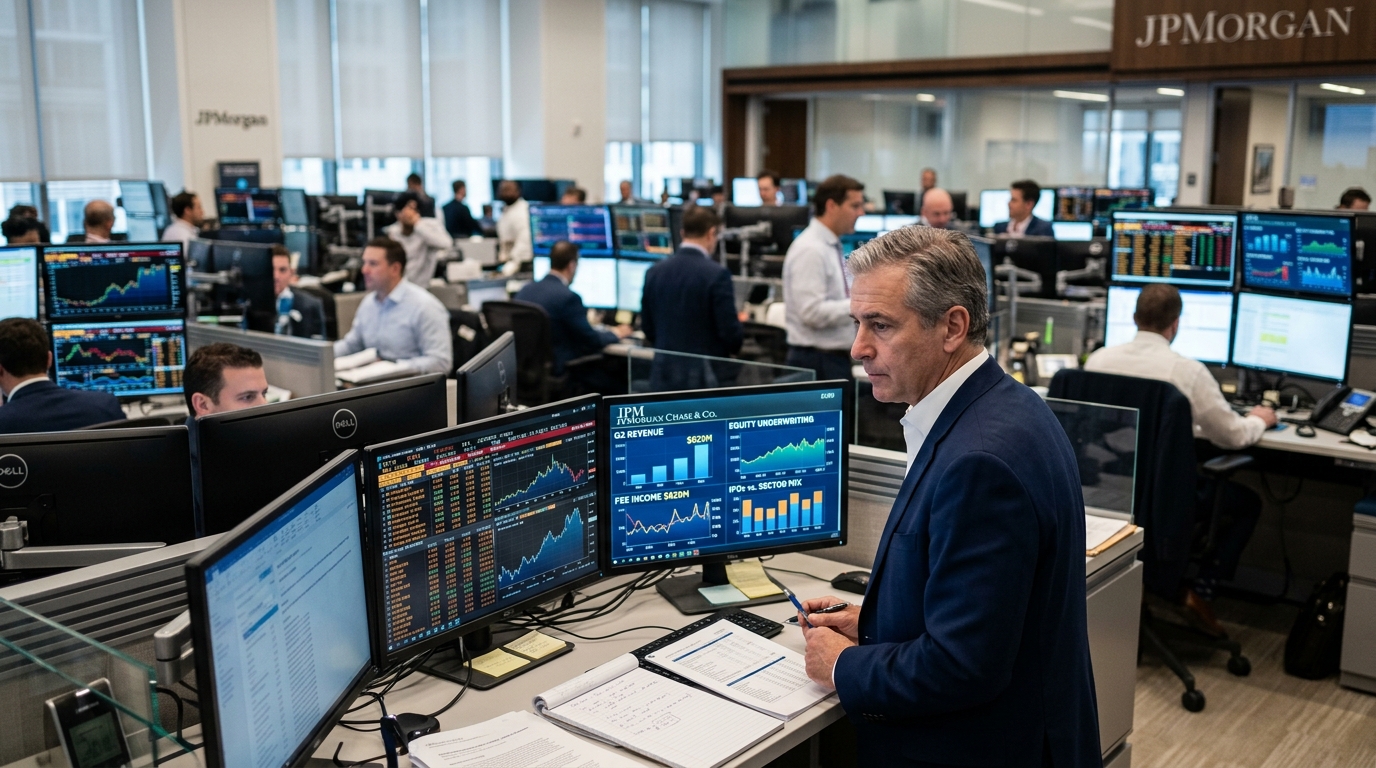
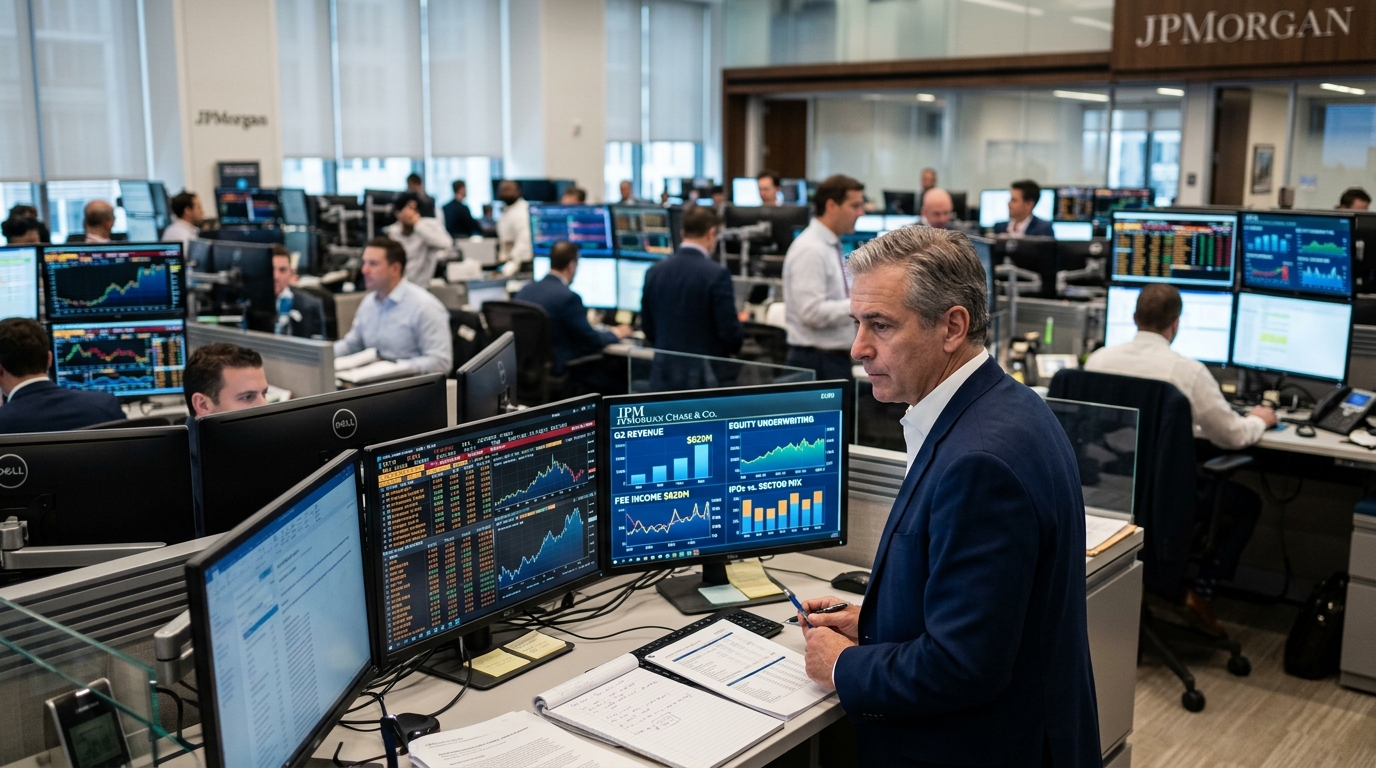
The headline number looked clean. $21.2 billion in Q2 net income, the largest quarterly profit in JPMorgan’s history. Peel back the one-time items, and the structural story underneath is both more durable and more fragile than the top line suggests.
What the numbers actually show
Excluding a $4.6 billion Visa stake gain and $1.0 billion in gains on certain equity investments, net income was $16.9 billion, or $6.14 per share, with a return on tangible common equity of 23%. That adjusted figure still demolished consensus near $5.55. The beat was real. The composition, however, tells a narrower story than the headline implies.
Equity underwriting fees hit $829 million, up 78%, driven by large IPOs and convertible offerings. Advisory fees came in at $1.012 billion, down 20% quarter over quarter but up 20% year over year, led by activity in financial institutions, technology, and diversified industries. Combined, those two lines drove the bulk of the investment banking fee surge. The problem: both are highly cyclical and window-dependent.
Equity markets revenue jumped 86% year over year to $6.0 billion, and total markets revenue reached $12.1 billion, topping the firm’s prior quarterly trading record set earlier in 2026. That record trading performance is hard to sustain. Volatility regimes normalize. Sponsor monetizations clear. IPO calendars get crowded and then stall.
The expense and rate picture
Expenses increased 15% year over year to $27.3 billion, driven by volume and revenue-related costs, front-office hiring, and labor inflation. Management raised the full-year expense outlook to roughly $107.5 billion, meaning cost growth is tracking the revenue surge almost point for point. Operating leverage, in other words, is thin.
JPMorgan revised its full-year net interest income outlook to roughly $105.5 billion, up from $103 billion three months earlier, with Q2 NII coming in at $25.6 billion, up 10%. That revision matters because NII is the one line that does not require a live IPO market or 86% equities revenue growth to perform.
Three scenarios for JPM into Q3
Bull case: The global ECM pipeline holds. Wall Street bankers have been talking up a robust pipeline of IPOs and equity offerings through the remainder of 2026, which would sustain underwriting fees above $600 million per quarter. NII stays near $25 billion with deposit balances intact. Shares push toward and above analyst targets.
Base case: Underwriting fees normalize from the Q2 spike. Trading revenues cool from record levels. NII anchors the earnings base near $16 billion in adjusted net income per quarter, with ROTCE holding around 20 to 21%.
Bear case: A risk-off shock, geopolitical escalation, or Fed hike extension freezes the ECM window. Dimon flagged geopolitical tensions and wars, sticky inflation, large global fiscal deficits and elevated asset prices as risks “shifting below the surface like tectonic plates.” If deal activity stalls, the fee-heavy CIB division takes the first hit.
Trading framework
JPM’s chart matters less here than the fee cycle. Watch weekly equity issuance volumes as the leading indicator for Q3 investment banking fees. If gross ECM supply runs above $30 billion per week through September, the bull case holds. Expense growth at 15% year over year sets a high bar for operating leverage to improve, so any revenue miss will punish the stock harder than the beat rewarded it. Position sizing around earnings should reflect that asymmetry.
The record quarter is not the trade. The sustainability of the fee engine that built it is.