
For a while now, I’ve been showing regular traders like you how to take advantage of a specific 60-minute window…
One that lets us go after 50% returns every morning – whether the market opens higher… or lower.
Here’s what I mean…
If you had spotted this 60-minute opportunity yesterday morning… all you would’ve had to do was place a quick trade before 10 am…
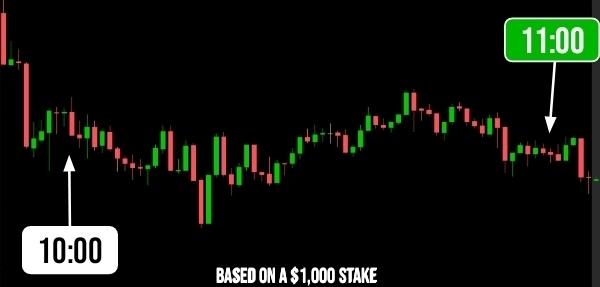
Went ahead with your morning plans and when you return a couple of minutes later, there’s a good chance you’d find $500 in extra income sitting in your account (on a 1k stake)
It wouldn’t have mattered what happened with the overall market… this 60-minute window would have been all you needed to target cash.
Today? Same story.
Place a quick trade, grab your coffee… and let the setup do the heavy lifting.
And just 60 minutes later… come back to what could be a nice $500 in extra income sitting in the brokerage account.
I designed the setup to be that straightforward.
Granted, there will be trades that won’t work out
But if you want in?
The U.S. Treasury Sells $39 Billion in 10-Year Notes Today

Two risk events are on the clock today, and both resolve before the close. At 1pm ET, Treasury prices $39 billion in 10-year notes into a market where the benchmark yield has touched about 5.33%, a level last seen in April 2002. One hour later, the September FOMC minutes hit at 2pm ET. Traders do not get to sequence these. They arrive on the same session.
Macro Context
The bond selloff is not subtle. The 10-year closed at 5.31% on October 5, up from 4.18% at year-end 2025, a move of 113 basis points in nine months. The 30-year has traded around 5.67% in early October, a level not seen since 2002. That is the environment into which Treasury must absorb $119 billion across three auctions this week: $58 billion in 3-year notes on October 6, $39 billion in the 10-year today, and $22 billion in 30-year bonds Thursday. TLT, the iShares 20+ Year Treasury Bond ETF, closed Monday at $77.11, down 8.44% year to date and down more than 36% over five years. Duration holders are already carrying real losses.
The macro catalyst behind the move is a Fed that just restarted its hiking cycle. On September 16, the FOMC voted 12-0 to raise the federal funds rate by 25 basis points to a target range of 3.75% to 4.00%, the first increase since 2023. The September dot plot revised the median year-end 2026 rate to 4.1%, implying one additional hike before December. Most participants penciled in at least one further move. Inflation remains the driver: August CPI rose 3.4% year over year, with energy supplying a disproportionate share of the monthly gain.
The Auction Metric That Matters
Today’s 10-year reopening is not a generic supply event. The number traders need is the indirect bid share, which captures foreign central bank and large institutional demand. At the September 24 seven-year auction, indirect bidders took only 57.2% against a trailing average near 64.6%. That seven-point gap is the reference point for today. A result above 64% would signal real-money buyers returning at these yield levels. A result below 57% would indicate the foreign demand shortfall is spreading from the belly to the benchmark tenor, which has direct implications for the 30-year sale Thursday and for TLT’s near-term floor.
The bid-to-cover ratio carries secondary weight. The September 9 ten-year reopening cleared at 4.834%, with a bid-to-cover of 2.7. Today’s auction will clear at a materially higher yield. The question is whether the higher rate clears at or through the when-issued level, or whether it tails, which signals demand was insufficient even at current prices.
FOMC Minutes: What the Curve Is Listening For
The minutes from the September 15 to 16 meeting arrive one hour after auction results post. Futures are pricing roughly an 80% probability of a hold at the October 27 to 28 meeting. The minutes will either confirm or complicate that read. Traders should watch for the breadth of support for additional hikes. If a majority of participants expressed comfort with stopping at 4.00%, the long end may stabilize. If the minutes show broad consensus for the 4.1% year-end median, another leg higher in yields becomes harder to fade. The two risk events are connected: a weak auction followed by hawkish minutes is a compounding negative for TLT and equity duration.
Scenario Modeling
Bull Case. Indirect bidders exceed 64%, the auction stops through the when-issued level, and the minutes show genuine internal disagreement about additional hikes. TLT reclaims the $79 level and the 10-year yield pulls back toward 5.10%. The 30-year auction Thursday becomes the next confirming event.
Base Case. Indirect bidders land between 59% and 63%, the auction tail is minor, and the minutes confirm one more hike this year without urgency. Yields hold near current levels. TLT trades in a $76–$79 range through the week. The market waits for October 14 CPI as the next directional catalyst.
Bear Case. Indirect bidders fall below 57%, the auction tails by two basis points or more, and the minutes reveal broader support for additional tightening than the statement implied. The 10-year yield breaks above 5.40%, the 30-year tests 5.80%, and TLT sets a new 52-week low below $76.69. Primary dealers absorb the unsold portion, raising the probability of a disorderly Thursday sale.
Active Trader Framework
The indirect bid number posts with auction results, typically by 1:15pm ET. That is the first decision point, not 2pm. Traders positioned in TLT or Treasury futures should assess their exposure before the minutes land, not after. Key technical levels: TLT $79 is the first resistance above current price and a reversal threshold for the downtrend. Support sits at $76.69, the 52-week low. On the yield side, 5.33% is the documented 2026 high. A close above that level on a weak auction day would mark a confirmed breakout with no recent resistance visible until the 2002 range.
Volatility expectations should reflect two sequential events, not one. Positioning ahead of 1pm, then holding through 2pm, compounds the risk surface. Sizing accordingly is not optional; it is the framework.
Preparation and level awareness outperform reaction every time. Today offers two structured opportunities to measure demand at multi-decade yields, with a precise clock attached to each. The session rewards traders who define their levels before results post, and who distinguish the auction signal from the policy signal when both arrive in the same afternoon.