July 2, 2026
Three Buyers. One Window.
First a message from Mode Mobile
Wall Street just sent investors a loud message.
The Dow hit a fresh record, but the Nasdaq 100 slipped as semiconductor stocks got hammered and the AI trade split in two.
The surprise winner? Software.
Major software ETFs surged and Meta jumped nearly 10% after announcing plans to sell excess AI compute capacity.
The message is clear: AI is no longer just about chips.
It is about software, data, and platforms that can turn everyday digital behavior into value.
That is exactly where Mode Mobile is building.
Mode’s EarnOS rewards users for everyday smartphone activity like browsing, listening, charging, and using apps. In the process, it creates a direct relationship with users and first-party data that could be monetized for AI model training.
The scale is already real:
- 490M+ users
- $115M+ cumulative revenue
- $1B+ earned and saved by users
- 32,481% 3-year revenue growth
- $MODE Nasdaq ticker secured
Deloitte named Mode the #1 fastest-growing software company in North America, and investors can still access shares before a potential IPO at $0.52/share, plus up to 20% bonus shares.
Click here to review Mode Mobile’s $0.52 pre-IPO opportunity now.
FEATURED
Three Buyers. One Window.
There is a version of the next six weeks that most investors are not running. Not because the data is hidden. Because each piece of it, in isolation, sounds like something you have heard before. Put them together and the picture gets more interesting.
Here is what is converging right now.
First: the corporate bid. U.S. corporates have authorized more than $925 billion in share repurchases year-to-date through late June 2026, the strongest pace ever recorded through this point in the year, according to Citadel Securities. Goldman’s buyback desk puts the full-year annualized run rate at $1.15 trillion, also a record. Technology and Financials account for roughly 57% of all announced buybacks, reinforcing demand in the same sectors already benefiting from retail participation and passive flows. That matters for one specific reason: that bid disappears during earnings blackout windows. Roughly 80% of the S&P 500 enters a repurchase blackout in the three to four weeks surrounding their earnings release. When $4.5 to $5.5 billion of daily corporate demand steps away from the market, the floor gets thinner. But here is the flip side of that math that almost nobody is trading: the blackout ends the moment earnings are reported. That means the largest single buyer in the U.S. equity market comes roaring back into the open window in late July, just as mega-cap tech finishes reporting. The corporate bid returns at full force with fresh authorization and a full treasury.
Big Oil walked away. That was the mistake.
Big Oil knew this energy source was there.
Chevron tried to tap it. Texaco tried. Unocal tried. Even the Soviets drilled deeper than Everest is tall trying to reach it.
Then they all walked away.
For decades, Wall Street treated it like a failed science experiment. But in a remote valley in Utah, a drilling crew just cracked the code.
They weren’t drilling for oil. They were drilling for heat. And Dylan Jovine believes one company is positioned at the center of the last energy revolution America may ever need.
Second: the cash mountain. Total U.S. money market fund assets stood at $7.90 trillion for the week ended June 24, according to the Investment Company Institute. Of that, retail investors alone hold $3.08 trillion. That pile was built when the Fed funds rate was above 5%. It is now being nudged toward risk as short-term yields drift lower. The 6-month T-bill yield has compressed meaningfully from its highs above 5%, and the spread versus equities is narrowing every week. The institutional tranche, $4.82 trillion, tells a different story. Most of it is functional liquidity. It is not going anywhere. But retail money market assets do not have that structural anchor. They follow yield. And yield is going the wrong direction for cash holders.
The math on even a partial rotation is not subtle. A 10% shift of retail money market assets into equities would inject roughly $300 billion into the market. That is not a prediction. It is context for understanding what the demand side of the ledger looks like if sentiment firms up.
Third: retail itself. This is the part that is genuinely new and still being underestimated.
Retail investors now account for roughly 30% of daily U.S. equity volume, with record options activity. Citadel Securities, which executes approximately 35% of all U.S. retail trading volume, reported that 9 of its 10 busiest trading days occurred within the past month. June 12 marked the largest single day of retail net buying ever observed on their platform, surpassing the prior record by 50%. On S&P 500 down days during the first half of 2026, retail investors bought nearly 3.5 times the average daily amount. That buy-the-dip behavior, held consistently across a six-month period, is no longer a sentiment reading. It is a structural feature of how this market functions.
Slight tangent, but it matters: retail options activity has entered what Citadel Securities calls a new regime. Retail options premium on their platform hit a record $6.8 billion per day in June, 17% above May’s record, 65% above the 2025 average, and more than double the historical average. Of that, approximately $1.9 billion per day was in semiconductor options alone, with roughly 75% of that concentrated in calls. Retail is not just buying stocks. It is building leveraged upside exposure to the sectors driving index performance. That changes the volatility profile in a meaningful way when the underlying bid accelerates. Meanwhile, nearly half of all retail options volume on the platform now trades in zero-days-to-expiry contracts, up from 30% in 2025 and just 13% in 2021, compressing the average time to expiry to under three days.
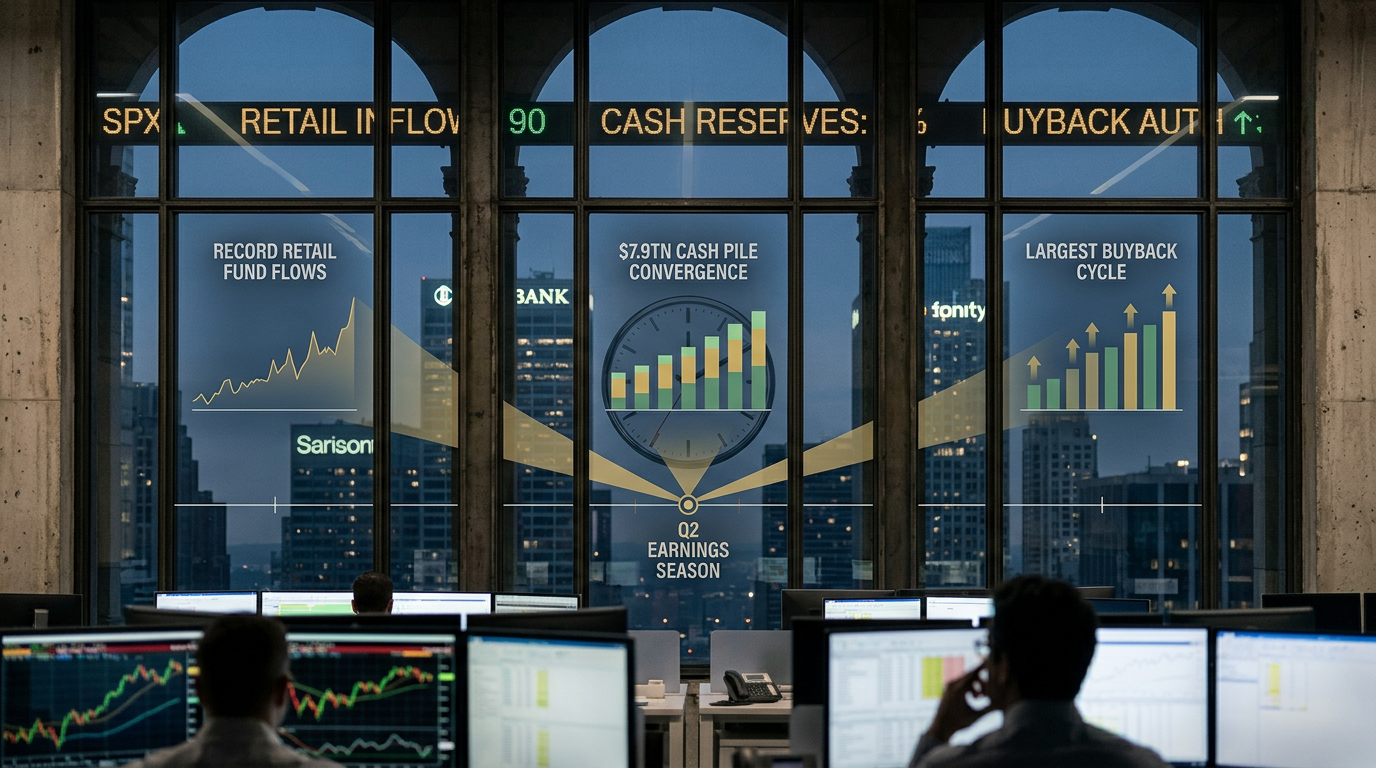
Now here is the part worth sitting with. All three of these forces, the corporate buyback machine, the $3 trillion retail cash pile, and the record retail participation rate, are pointing in the same direction. And they are converging at the same moment: the Q2 earnings reporting window opening in mid-July.
Q2 earnings season begins in earnest the week of July 14, when Citigroup, Wells Fargo, Goldman Sachs, and Morgan Stanley all report, with JPMorgan expected on the same day, July 14, before market open. Big Tech follows later in the month, with Alphabet expected July 22, and Microsoft, Meta, and Apple reporting in the final week of July. FactSet projects S&P 500 earnings grew above 20% in Q2, which would mark the second consecutive quarter above 20% growth. Analysts actually raised Q2 estimates by 3.4% during the quarter, compared to a typical decline of 2.7% over the prior ten years. The percentage of S&P 500 companies issuing positive EPS guidance for Q2 stands at 57%, well above the five-year average of 41%. That revision higher, in a quarter when estimates typically fall, is the data point the bears have the hardest time explaining away.
The picture is not uniformly bullish. There are real questions embedded in that earnings calendar. Banks will reveal how much net interest margin pressure has built from elevated deposit competition. The consumer discretionary sector has shown softening revenue and free cash flow relative to the broader market. Low consumer confidence creates a ceiling on discretionary spending that companies will have to address on guidance calls. And the broader market concentration story does not go away: the ten largest S&P 500 companies still account for nearly 40% of the index, a level that has been near record highs for the better part of a year. The forward 12-month P/E ratio sits at 21.0, above both the 5-year average of 19.9 and the 10-year average of 18.9.
He Called Nvidia Before It Soared 5,000%
He recommended Tesla before 3,500%, and AMD before 8,500%. Luke Lango has a track record few analysts alive can match. Now he’s making his biggest call yet – ahead of the OpenAI and Anthropic IPOs.
What investors are missing is not the bullish data or the bearish data. It is the timing sequence. The buyback blackout removes the corporate floor just as earnings catalysts hit. If reports disappoint, there is less cushion. If reports impress, the corporate bid re-enters a market simultaneously receiving a retail options feedback loop and facing potential money market rotation pressure from declining short-term yields. The asymmetry in the upside scenario is larger than most models account for.
Where the Options Market Is Positioned
With retail options volume at record levels and semiconductor call buying running at 6x historical averages, implied volatility on individual names heading into earnings is elevated but not extreme. That creates specific dynamics around earnings: the expected move is priced wide, which means directional bets carry a higher premium cost. Defined-risk structures, spreads rather than outright calls, reduce the premium burn while maintaining exposure to the upside scenario.
For traders watching the post-earnings buyback resumption thesis, the cleanest expression is in names with the largest pace-of-buyback relative to float. Apple, Meta, Alphabet, JPMorgan, and Bank of America all run programs large enough that their re-entry into the open window after blackout creates measurable, historically documented demand. Pair that with improving earnings catalysts and the retail call-skew already in place, and the feedback loop becomes self-reinforcing.
For those skeptical of the melt-up path, the risk case has a specific shape: if earnings guidance disappoints broadly, the money market pile stays where it is, retail momentum reverses, and the corporate bid is still days away from re-entering. That three-to-four week window between blackout start and earnings completion is the market’s most structurally thin moment of the quarter. It is the window where weak guidance does the most damage.
The Structural Question Behind All of This
The defining story of the first half of 2026 has not been a macro shock. As Citadel Securities put it in their H1 market structure review, it has been “the continued structural transformation of equity markets.” Concentration, passive dominance, retail participation, leverage, and volatility are no longer independent variables. They reinforce each other. The fastest growth in equity ownership is occurring among households that historically had the lowest market participation rates.
U.S. households held $55.15 trillion in corporate equities and mutual fund shares in Q1 2026, according to Federal Reserve Flow of Funds data, with equities making up 45.76% of household financial assets, near a series high. That concentration of household wealth in equities creates a reflexive quality to the market: when stocks go up, household wealth rises, confidence follows, and participation deepens. When stocks go down, the reverse happens faster than it used to, because more households are exposed and more of them are active traders rather than passive holders.
That is the risk embedded in the current moment that is not being fully reflected in prices. The market’s demand structure is historically strong. But it is also more reflexive, more concentrated, and more leveraged at the retail options layer than it has ever been. The three-buyer convergence around earnings season is a real dynamic. So is the fragility that comes from a market where three concurrent demand forces can, if sentiment shifts, all reduce exposure at the same time.
STOP SELLING On Fridays…
Every late Friday afternoon like clockwork, traders close their positions for the week. But not this veteran trader.
He’s loading up knowing breaking after-hours news is about to drop that’ll have you desperate all weekend and scrambling to buy back shares on Monday morning at twice… even triple what you sold them for.
All the while he gets to bank as much $16,159 or more just for holding shares over the weekend.
The corporate profits picture provides some fundamental grounding. S&P 500 earnings are now projected to rise more than 24% for the full year 2026, per the most recent FactSet estimates, up sharply from the 17% forecast at the start of Q2. For calendar year 2026, FactSet projects Q3 growth of 26.8% and Q4 growth of 24.4%. Buybacks are funded by genuine cash generation, not leverage. That earnings revision cycle, moving higher during a quarter when estimates typically fall, is the data point that gives the demand convergence thesis its fundamental footing.
The next thirty days are where the thesis gets tested. Banks report first, then the industrials, then Big Tech. What management teams say about the second half, about credit quality, capital expenditure plans, and consumer health, will either validate the demand convergence picture or expose the gaps in it. The history of Q2 earnings seasons with back-to-back 20%-plus growth is short. There is no clean playbook for what comes next. That is, in its own way, the most interesting thing about the current moment.
- Watch: Corporate buyback re-entry timing relative to individual earnings release dates for Apple, Meta, Alphabet, and the major banks
- Watch: Retail money market fund weekly flows from ICI for any acceleration in outflows toward equities as T-bill yields compress
- Watch: Q2 bank earnings guidance on net interest margins and commercial real estate exposure as the first read on credit health
- Watch: S&P 500 options call skew in the week following major earnings reports as a real-time gauge of retail feedback loop re-engagement
- Watch: Equal-weight S&P 500 performance relative to cap-weight as a breadth signal for whether the demand convergence is lifting all boats or concentrating in the familiar handful
- Risk factor: The buyback blackout window itself, the three-to-four week period when the corporate floor is thinnest, coincides exactly with peak earnings volatility. Any broad guidance disappointment in that window hits the market without its largest systematic buyer present.
For informational and educational purposes only. Not investment advice. Trading involves risk, including loss of principal.