|
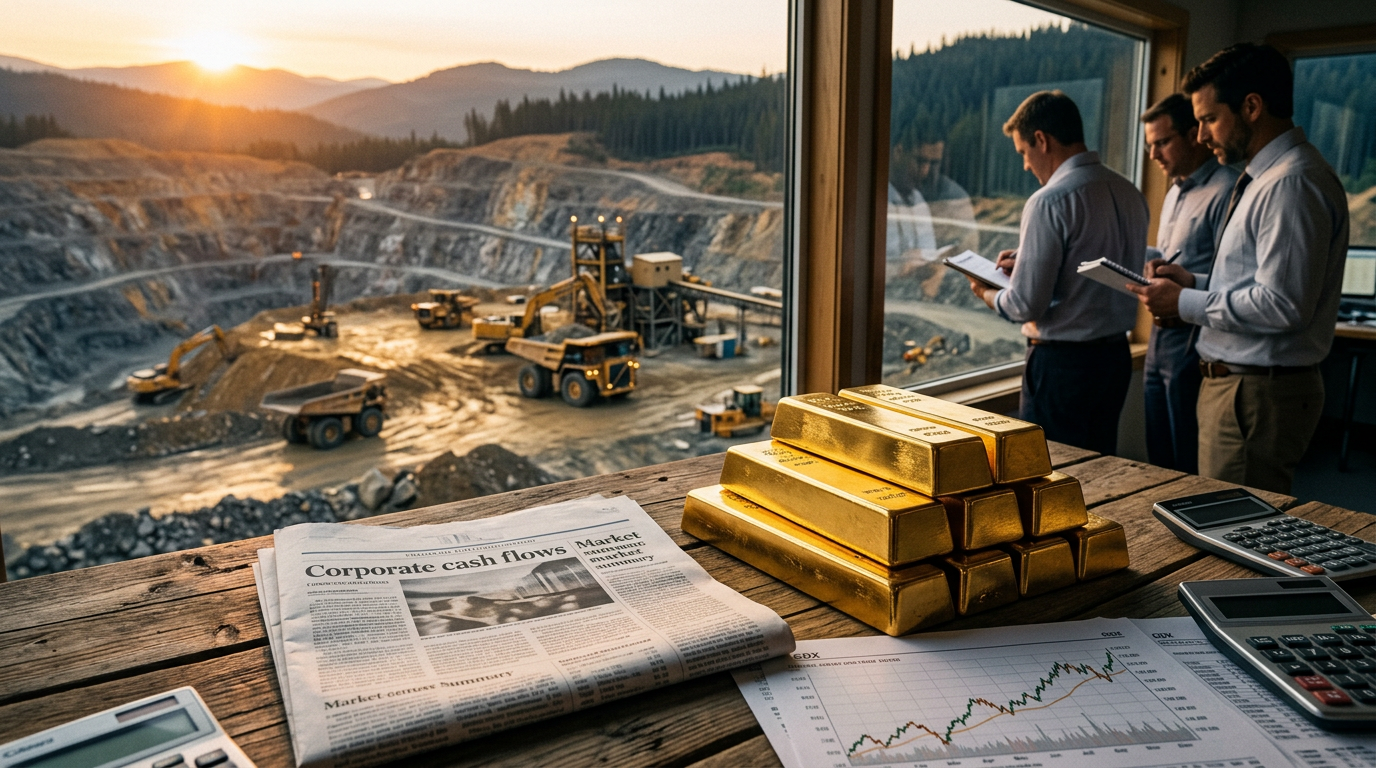
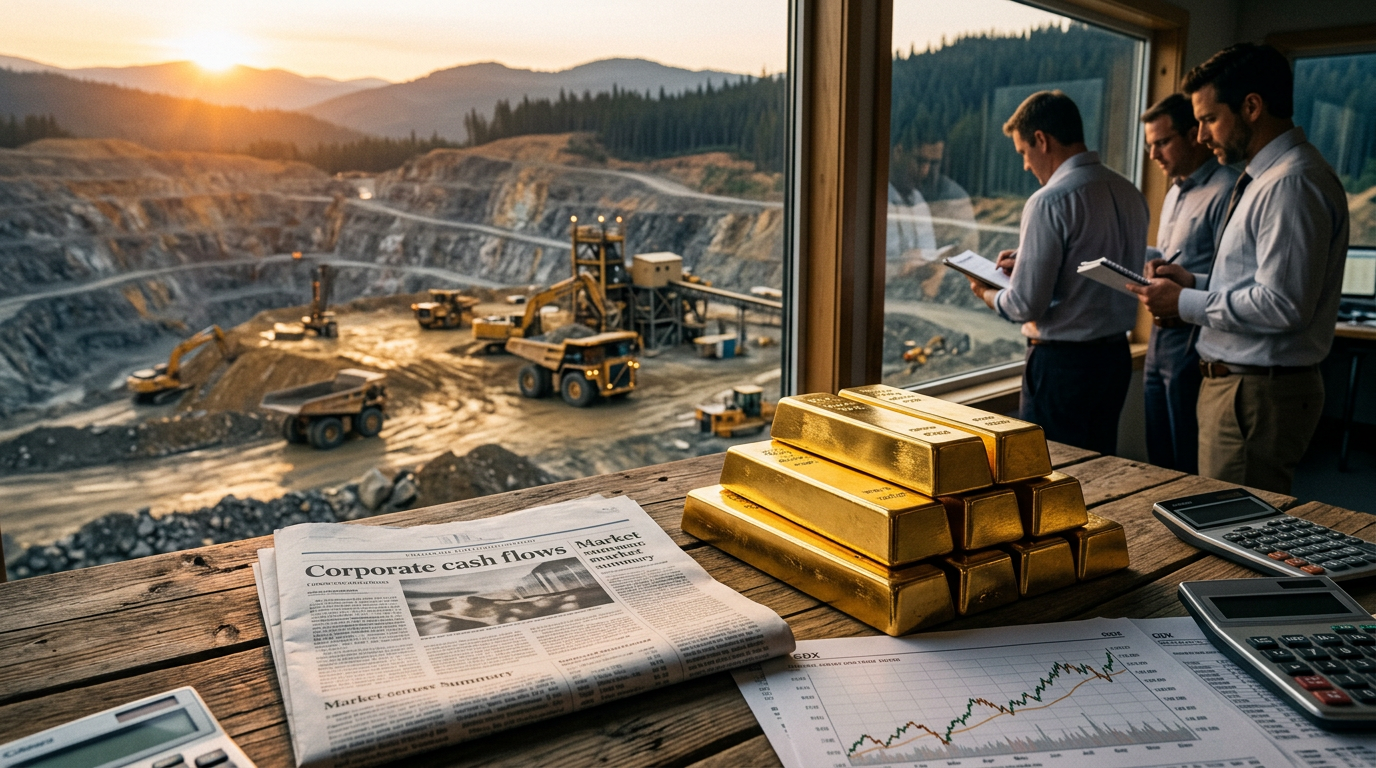
There’s a peculiar thing happening in Q2 2026. Big Tech is ratcheting past $700 billion in AI capital spending. Chip stocks are trading on 2028 earnings projections. And buried somewhere between the Nvidia updates and the LLM launch announcements — almost completely ignored — is a sector printing the most cash it has ever generated in its history.
Gold miners. Not exactly what fills financial Twitter.
But look at the numbers, because they demand attention. Newmont Corporation (NEM) alone generated $3.14 billion in free cash flow in Q1 2026 — the largest quarterly print in company history. Full-year 2025 FCF came in at $7.3 billion, a 150% year-over-year increase. Newmont returned $3.4 billion to shareholders last year and repaid $3.4 billion in debt, ending 2025 with a $2.1 billion net cash position. The company is currently in the middle of a $6 billion share repurchase program.
Meanwhile, Barrick Mining (GOLD) delivered Q1 2026 adjusted EPS of $0.98 per share — up 180% from a year earlier, ahead of Wall Street estimates. Revenue reached $5.22 billion versus a $4.84 billion estimate, up 67% year over year. Operating cash flow jumped 111% to $2.55 billion. Barrick announced a $3 billion buyback alongside earnings. Agnico Eagle generated $727 million in FCF for the quarter. Kinross did $856 million. The sector is collectively drowning in cash.
The Valuation Disconnect That Matters
Here’s the part most institutional analysts are now flagging as anomalous. Newmont trades at roughly 13x forward earnings — a meaningful discount to the S&P 500’s historically elevated 18–22x range. That’s a company with 40% net profit margins, a net cash balance sheet, and a $6 billion buyback in progress, trading at a cyclical discount while generating technology-company-grade returns on capital.
|
|
AI Meltdown has Began: Take These Five Steps Now
Do you see the similarities? That’s why Jim Rickards is warning Americans to prepare for an imminent AI meltdown.
As the main supplier of internet infrastructure, Cisco was the “Nvidia of the internet.”
When the dotcom bubble popped, shares crashed 90%…
And spent the next 25 years trying to recover.
If you cannot afford to suffer that kind of devastating loss…
Click here to get the details and learn how to prepare.
|
The gold miners-to-S&P 500 relative performance ratio broke out of a decade-long sideways range in mid-2024. By March 2026 it touched 0.14 — nearly triple the 0.05–0.08 range it occupied from 2015 through 2024. This isn’t a speculative breakout. It’s a rerating of cash-generative businesses in an environment where the underlying commodity price has structurally shifted.
|