
August 23, 2026
Nvidia Reports Aug. 26: What Traders Watch
Seventeen straight beats. Four straight post-earnings drops. The guide is the only number that moves this stock.
First a note from Media Pub
HI, I’m Alex Reid.
After trading the markets for years and licensing stunning algos for private clients back in the day…
I figured I should come clean about a shocking AI breakthrough.
At its core, this AI secret scans the market every morning for stocks that have been quietly building momentum over days or even weeks…
And are now nearing a potential point of acceleration.
Instead of chasing headlines, the software narrows the field to the single stock most likely to make a decisive move within the day.
It doesn’t stop there…
It goes a step further by outlining specific options criteria designed to align with that move, aiming to translate price action into outsized trade opportunities.
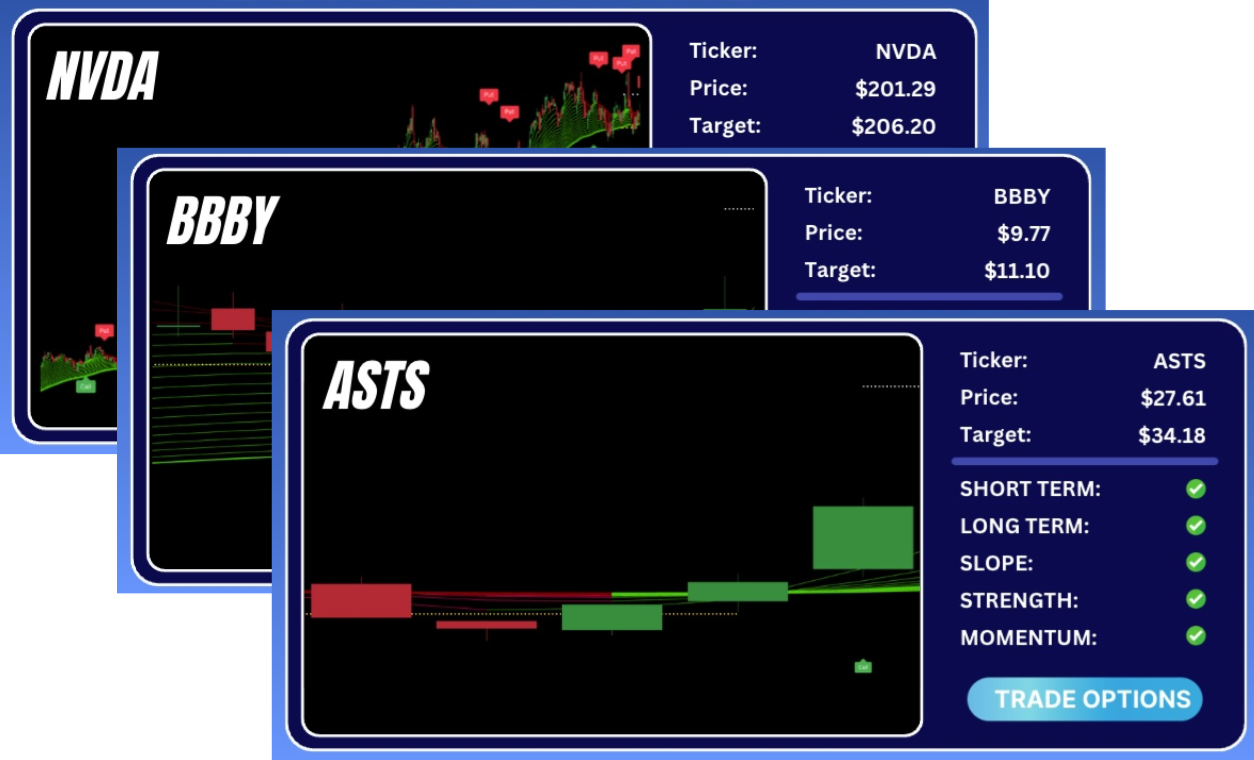
Basically, you’re being handed everything you need to take a trade even before you sit down for a sip of your morning coffee.
I can’t make guarantees when it comes to trading.
But if you’d like to see how the Wave Software identifies momentum before it becomes obvious…
And how you can begin using it for your trades as soon as tomorrow morning…
I’ve laid out all the details right here.
To Better Trading,
Alex Reid.

The Market Already Knows Nvidia Will Beat. That Is Not the Trade.
Nvidia has beaten its own revenue guidance in thirteen consecutive quarters. The size of the beat has been compressing the entire time, from 22.8% above the guide midpoint in Q2 FY2024 down to 4.6% in Q1 FY2027. The trend is visible, the math is public, and the market has priced it in. What it has not priced in, at least not with any certainty, is what August 26 says about the third quarter, about the Vera Rubin ramp, and about whether gross margins can hold at 75% while a new architecture scales into volume production.
That is the trade. Not the Q2 revenue number. Not the EPS beat. The forward guidance, the margin line, and the commentary around a platform transition that management has been telegraphing for two quarters. Traders who walk into August 26 anchored to the revenue figure are looking at the wrong data point. This piece is a framework for looking at the right ones.
Bullet Summary
- Nvidia reports Q2 FY2027 after the close on August 26. Company guidance calls for $91 billion in revenue (plus or minus 2%). Wall Street consensus sits at approximately $91.85 billion, just 1.3% above the guide midpoint — the tightest spread between analyst expectations and company guidance in recent memory.
- Q1 FY2027 delivered $81.6 billion in revenue, up 85% year over year. Data Center revenue of $75.2 billion grew 92%. Non-GAAP EPS of $1.87 beat the $1.77 estimate. Both figures came in well above what any other semiconductor company has ever reported in a single quarter.
- The four largest hyperscalers, Amazon, Alphabet, Microsoft, and Meta, have collectively guided to approximately $725 billion in combined capital expenditures for 2026, up 77% from the $410 billion record set in 2025. Analysts project combined hyperscaler capex topping $1 trillion in 2027.
- The options market is pricing a 5.27% implied move on NVDA into August 26. The stock closed at $214.72 on August 21, off roughly 4.6% on the week. The 52-week range runs from $164.07 to $236.54.
- Nvidia has dropped after each of its last four earnings releases despite beating estimates each time. The seven-day post-earnings window has produced a negative median return of 3.5% across the last seventeen reports. The market is not paying for the beat. It is paying for the guide.
- Vera Rubin entered full production in June 2026 at GTC Taipei, with initial shipments to cloud providers and AI labs beginning in Q3. The platform pairs an 88-core Arm-based Vera CPU with Rubin GPUs carrying 288 GB of HBM4 memory per device, and delivers roughly 3.5 times the training performance of Blackwell.
- TSMC’s N3 process capacity and HBM4 supply from SK Hynix and Samsung remain the binding constraints on Vera Rubin output. Analyst estimates put 2026 Rubin GPU production at 200,000 to 300,000 units. How management characterizes this supply picture will matter as much as any revenue figure.
The Macro Environment Heading Into August 26
The macro backdrop is complicated in ways that matter specifically for Nvidia. The 30-year Treasury yield climbed to its highest level since 2007 in the week before the report. Rising long-term borrowing costs apply real pressure to data center development economics, since most hyperscaler AI infrastructure is financed against long-duration capital plans. Fed Chair Kevin Warsh’s appearance at Jackson Hole on August 22 introduced additional rate uncertainty at exactly the wrong moment for sentiment around capital-intensive AI spending.
None of this has visibly slowed the capex commitments. Amazon projects $200 billion in capital expenditures for 2026. Alphabet raised its ceiling to $205 billion at Q2 2026 earnings after its first-half capex surged 111% to $98 billion. Meta has raised 2026 guidance twice, with the latest figure approaching $145 billion. Microsoft is tracking toward approximately $190 billion for the calendar year. Combined, the four hyperscalers are committing roughly $725 billion to AI infrastructure in 2026, up 77% from the $410 billion record set in 2025. Goldman Sachs projects combined hyperscaler capex reaching $5.3 trillion between fiscal year 2025 and fiscal year 2030.
The tension that matters for the August 26 call is this: Alphabet’s Q2 2026 earnings report, which revealed the company turned cash flow negative in the second quarter for the first time, spooked investors despite strong underlying AI revenue growth. The hyperscalers are spending at a pace that is compressing free cash flow across the sector. Markets are beginning to ask, with more urgency than they did a year ago, when the return arrives. Nvidia’s Q2 report lands in the middle of that debate, and management commentary on forward demand visibility will be parsed in that context.
The Consensus Picture: What the Numbers Say Before the Report
Forty analysts tracked by Yahoo Finance have Q2 FY2027 revenue at $91.85 billion and non-GAAP EPS at $2.08. Nvidia’s own guidance was $91 billion, plus or minus 2%, meaning consensus sits just 0.9% to 1.3% above the guide midpoint depending on the source. That is the narrowest gap between street expectations and company guidance Nvidia has seen in recent cycles, and it carries a specific implication: there is almost no runway for a meaningful revenue beat. The incremental cushion is roughly $1.16 billion on a $91 billion base. A beat of that magnitude, against a company that beat by more than 22% two years ago, will not move the stock.
What can move the stock: the Q3 revenue guide. Whether it clears $100 billion matters. Whether gross margin guidance holds at or above 74% during the Vera Rubin production ramp matters. Whether management says anything about China, about H200 export license approvals, about the pace of Rubin deployments at the hyperscalers matters. The revenue line for Q2 is a footnote. The Q3 outlook is the report.
For context on what the Q2 number would represent if Nvidia clears consensus: $91.85 billion in a single quarter is roughly double what the company did in Q2 FY2026, when it reported $46.74 billion. Year-over-year growth of approximately 96% from a base that was itself a record at the time. These are the numbers traders are now treating as baseline. That recalibration of expectations is precisely why the post-earnings reaction has been negative four consecutive times.
Why the Market Has Stopped Rewarding the Beat
Across seventeen consecutive earnings reports, Nvidia has beaten its revenue guidance 100% of the time and beaten EPS estimates 88% of the time. The median one-day stock reaction across those seventeen reports is essentially zero. The seven-day window has produced a negative median return of 3.5%, with ten of seventeen post-earnings weeks closing in the red.
The four most recent quarters make the pattern explicit. After Q2 FY2026 results in August 2025, the stock closed lower. Q3 FY2026 in November produced an initial bounce that reversed into a 3% decline over the following week. Q4 FY2026 in February 2026 sent shares down roughly 5%. After Q1 FY2027 in May 2026, they fell again. Four consecutive drops. Four consecutive beats. The data says these are not independent events: when expectations are fully loaded before the report, a revenue beat is already in the price, and anything that falls short of a perfect forward guide gets sold.
Jefferies analyst Blayne Curtis, writing ahead of the August print, anticipated a beat-and-raise outcome but flagged explicitly that any likely upside seems broadly anticipated by the market. That is the precise condition under which post-earnings declines occur regardless of the headline number.
Sector Breakdown: Where $725 Billion Goes
The $725 billion in combined hyperscaler capex for 2026 does not distribute evenly across the technology landscape. The overwhelming majority flows to AI compute, data center construction, networking, and power infrastructure. Nvidia GPUs absorb the largest single share of the compute budget. Custom silicon, primarily Google’s TPUs, Amazon’s Trainium, Microsoft’s MAIA, and Meta’s MTIA, captures a growing but still secondary portion, concentrated in inference workloads where the hyperscalers have the most incentive to reduce dependency on merchant GPU pricing.
The competitive arithmetic is worth stating precisely. Nvidia retains approximately 80% to 81% of the AI accelerator market by revenue. Custom ASIC shipments from hyperscalers are projected to grow 44.6% in 2026 versus 16.1% for merchant GPUs, per TrendForce. AMD’s Instinct line holds an estimated 5% to 7%. Hyperscaler-designed chips are expected to capture 15% to 25% of the total accelerator market, primarily in inference. Nvidia’s training share remains above 90%. The CUDA software ecosystem, with more than 5 million active developers, creates friction that hardware benchmarks alone cannot price.
Two dynamics that get underweighted in the competitive framing. First, every dollar a hyperscaler spends on custom silicon for inference is a dollar that still requires Nvidia’s training infrastructure to produce the models being inferred. Second, the H100 spot rental market tells its own story: cloud pricing for Hopper-generation hardware is up approximately 20% year to date even as Blackwell systems proliferate. Scarcity persists across the entire stack, which is supply-constrained, not demand-constrained, in the words of the hyperscalers themselves.
Vera Rubin: The Platform Transition That Changes the Forward Math
At GTC Taipei on June 1, 2026, Nvidia announced the Vera Rubin platform was ramping into full production. The announcement moved earlier than most analysts had modeled: the consensus heading into 2026 had Rubin availability penciled for early 2027. Initial shipments to major cloud providers including Microsoft and Google began in July, with volume ramp targeted for Q4 2026 and broad adoption extending into 2027.
The Vera Rubin architecture is not an incremental GPU update. The platform pairs an 88-core Arm-based Vera CPU with Rubin GPUs carrying 288 GB of HBM4 memory per device, delivering approximately 3.5 times the training performance of Blackwell. The NVL72 server aggregates 72 GPUs linked by NVLink 6, producing 3.6 terabytes per second of inter-GPU bandwidth. Each rack draws 190 to 230 kilowatts depending on configuration, compared to 120 to 130 kilowatts for Blackwell systems. The power density alone requires data center operators to redesign cooling and power delivery infrastructure, which is both a friction point for adoption pace and a long-term moat for Nvidia’s rack-scale economics.
The supply constraints are real and worth tracking specifically. TSMC’s N3 process, which manufactures the Rubin GPU at roughly 336 billion transistors, is shared with Apple’s latest processors and AMD’s MI400 series. Nvidia has secured long-term capacity agreements, but analyst estimates put 2026 Rubin GPU output at 200,000 to 300,000 units. HBM4 supply from SK Hynix and Samsung, which began mass production in Q4 2025 with yields still below mature HBM3e levels, represents the second bottleneck. Each Rubin GPU requires 288 GB of HBM4, roughly six times the memory per device compared to consumer GPUs.
What management says on August 26 about Rubin shipment volumes, HBM4 allocation, and the Q4 production trajectory will carry more weight than the Q2 revenue line. Analysts who have modeled incremental Rubin contribution in Q3 will update those numbers in real time on the call. Any language suggesting testing delays, extended qualification cycles, or supply friction gets sold. Confirmation of Q3 initial volume and a clear Q4 ramp trajectory gets bought.
Options Market: What a 5.27% Implied Move Actually Means
Benzinga Pro data puts the options-implied move for NVDA into August 26 at approximately 5.27%. On a company worth roughly $5.2 trillion, that move corresponds to approximately $275 billion in market value swinging in a single session. The implied band runs from approximately $201.84 to $227.60, based on the August 21 close of $214.72.
Implied volatility heading into the report sits near 40%, with an IV Rank near 36, placing current pricing in the moderate third of Nvidia’s own one-year range. Realized 30-day historical volatility runs at approximately 38.48%. The gap between implied and realized is narrow, roughly two percentage points. That combination points toward a specific structure conclusion: the options market is not expressing fear, but it is pricing enough event uncertainty to make naked premium selling uncomfortably exposed.
The historical data on NVDA earnings moves is instructive. The average actual move across the last sixteen reports is approximately plus or minus 8.3%, with more recent periods compressing toward plus or minus 5.4%. The stock clears its implied move in roughly one of every four reports, approximately a 25% hit rate for long volatility positions. IV rushes into the event and collapses immediately after. Across sixteen reports, owning a straddle into Nvidia earnings has been a persistently difficult position, even as the company has beaten estimates in every one of those reports. The math works against long volatility here, as it has for years.
Put and call flow in the weeks before the August report has leaned call-heavy, consistent with the AI trade’s resurgence through July. Institutional hedges via near-dated puts are visible in the chain at strikes in the 8% to 10% downside zone. This is not a bearish positioning. It is the standard protection layering that large holders apply before a known binary event, particularly after four consecutive post-earnings declines in a name they still hold long.
Scenario Modeling
Three scenarios for what happens after the close on August 26. Each carries specific conditions, price implications, and structure considerations. These are analytical frameworks, not instructions.
Bull Case: Beat, Raise, Rubin Confirmed
Conditions required: Q2 revenue clears $93 billion or above. Q3 guidance comes in at $100 billion or higher. Non-GAAP gross margin guidance holds at or above 74.5%. Management confirms Q3 Vera Rubin initial volume shipments are on track, characterizes Q4 as a volume ramp quarter, and provides language suggesting HBM4 supply constraints are easing. Any incremental China optionality from H200 license approvals would represent unguided upside against a guide that currently assumes zero China Data Center compute revenue.
Price implication: The 68-analyst price target consensus sits near $303 to $305, implying approximately 40% upside from the August 21 close of $214.72. A strong beat-and-raise that closes the gap between current price and that consensus target plausibly moves the stock into the $225 to $235 zone on the first day, with continued upside into Rubin volume confirmation in Q4.
Structure consideration: A bull call spread, buying a near-the-money call and selling a higher-strike call at September or October expiration, limits premium outlay while capturing directional exposure. Given an IV Rank near 36 and the historical IV crush pattern, naked long calls require the actual move to exceed the implied 5.27% move, which history suggests happens roughly 25% of the time.
Bear Case: Guidance Miss or Margin Compression Signal
Conditions required: Q2 revenue beats but Q3 guidance comes in below $95 billion, or gross margin guidance for Q3 drops below 74% on rising DRAM, wafer, advanced packaging, and substrate costs during Vera Rubin ramp. Any language about extended testing cycles, production friction at TSMC N3, or HBM4 supply tightening beyond current assumptions would amplify the sell reaction. The stock has declined after each of the last four earnings releases, and a fifth consecutive drop following another beat-and-modest-raise would not be a statistical anomaly.
Price implication: The historical average actual earnings move of 8.3% implies a downside zone near $196 to $200 from the August 21 close of $214.72. The 52-week low sits at $164.07. A guidance miss severe enough to reopen the debate about whether the Rubin transition is executing on schedule would likely test the $195 to $200 zone as an initial target.
Structure consideration: A bear put spread, buying a near-the-money put and selling a lower-strike put, provides defined downside exposure with capped premium. Outright long puts face the same IV crush headwind. Targeting the short leg near the 8% to 10% downside zone, approximately $194 to $198, captures the historical average move range while keeping premium outlay manageable.
Neutral Case: Beat-and-Raise, Muted Reaction
Conditions required: Nvidia delivers revenue above consensus, guides Q3 to $95 to $100 billion, holds gross margins near 75%, and provides constructive but not blockbuster Vera Rubin commentary. The market digests the report without a decisive directional move. This is historically the most likely outcome: NVDA has cleared its implied earnings move only about 25% of the time. A mid-single-digit reaction in either direction, well within the 5.27% implied band, is the statistical base case.
Price implication: Stock closes within the $201 to $228 implied band. No structural re-rating in either direction. The forward focus shifts immediately to Rubin Q4 volume data and Q3 data center revenue confirmation in November.
Structure consideration: An iron condor, selling an out-of-the-money call and an out-of-the-money put while buying further out-of-the-money wings for protection, collects premium if the stock stays within the defined range. The structure benefits from IV crush regardless of direction. Maximum profit is collected at expiration if the stock closes between the short strikes. The tail risk is a guidance shock that sends the stock outside the short strikes, so position sizing relative to the defined loss zone on both wings is the primary risk management variable.
Active Trader Framework: What to Monitor on August 26
The earnings call begins after the close. The transcript matters as much as the press release. These are the specific data points and language signals that experienced traders will be tracking in real time.
- Q3 revenue guidance, the only number that moves the stock. Does it clear $100 billion? Does it include any incremental China optionality? The guide midpoint will set the tone for the post-earnings session within seconds of the press release.
- Gross margin guidance, word by word. Nvidia maintained 75.0% non-GAAP gross margins in Q1 while excluding all China Data Center compute revenue from the guide. That is exceptional pricing power. Any Q3 margin guidance below 74% signals that Vera Rubin ramp costs are biting and will accelerate selling regardless of the revenue number.
- Vera Rubin volume cadence. Initial Q3 shipment volumes, specific customer confirmations, and any quantification of Q4 ramp targets. Management language about HBM4 availability and TSMC N3 capacity will be the most closely watched technical disclosure on the call.
- China commentary. The Q2 guide assumed zero Data Center compute revenue from China, unchanged from Q1. H200 export licenses have reportedly been approved. Whether any revenue materialized in Q2, and how management characterizes forward China optionality, determines whether that is a real tailwind or a theoretical one.
- VWAP and intraday structure on August 27. Nvidia’s post-earnings price action over the last four quarters has been negative even on strong results. Watch whether the stock opens above or below the prior close, how it trades relative to VWAP in the first 30 minutes, and whether volume confirms or fades any initial directional move. A gap up that fades back through VWAP on above-average volume has been the template for the recent post-earnings pattern.
- Key technical levels. The 200-day moving average near $195 to $200 acts as the primary support zone in the bear case. The $225 to $228 range near prior swing highs represents initial resistance in the bull case. The 52-week high of $236.54 is the retest level if the report triggers a durable re-rating.
- Position sizing discipline. The 95th-percentile implied earnings move for NVDA across the last sixteen reports is approximately plus or minus 20%. Defined-risk structures on both sides, spreads rather than naked directional exposure, are appropriate given both the IV Rank at 36 and the historical tail distribution.
Will You Survive the MAR-A-LAGO RESET?
Bloomberg calls it “a dire shift of fortunes for America” and The Wall Street Journal calls it a “New World Order.” Now, Dr. David Eifrig – a 40-year market veteran who traded through Black Monday and has recommended more than a dozen triple-digit winners – warns that you must make one of the most important financial decisions of your lifetime today.
He strongly recommends this ONE step to potentially secure your retirement.
Risk Analysis: The Structural Risks That Were Present Last Quarter and Remain Present Now
- Gross margin compression on the Vera Rubin transition. Platform launches compress margins before scale-driven cost reductions arrive. Blackwell followed exactly this trajectory. Rubin is expected to command higher rack-level pricing, but the transition quarter is historically where margin pressure peaks. Management’s full-year fiscal 2027 gross margin language will signal whether the mid-70% floor is credible through year-end.
- HBM4 and TSMC N3 supply as hard ceilings. SK Hynix and Samsung HBM4 yields remain below mature HBM3e levels. TSMC N3 is shared with Apple and AMD. These are not theoretical constraints. They are binding production ceilings that cap how much Rubin revenue can appear in any single quarter regardless of demand. If management guides conservatively on Q3 Rubin contribution, the supply story is the explanation, not demand weakness. Traders should distinguish between those two causes because the long-term implications are completely different.
- China: zero is already in the guide, but it is not static. Any tightening of export restrictions beyond the current H20 prohibition would be a sequential worsening against a number that already assumes zero. That downside is not in the consensus model. Any thaw in restrictions that allows H200 revenue is pure upside. Both tails exist, and neither is fully priced.
- Post-earnings pattern as a risk in itself. Four consecutive post-earnings declines despite beat-and-raise execution means the market has demonstrated a consistent willingness to sell the event regardless of the result. Traders who assume a clean beat guarantees a positive reaction are working against the recent statistical record. Position sizing accordingly is not pessimism. It is reading the data correctly.
- Hyperscaler free cash flow pressure as a medium-term demand signal. Alphabet turned cash flow negative in Q2 2026 for the first time. Microsoft analysts project negative free cash flow in Q4 for the first time since at least 2001. Amazon is tracking toward negative free cash flow for the year. The hyperscalers are spending through the cash constraint because they believe the competitive cost of not building is higher than the financial cost of building. But if any of them signals a deceleration in forward spending plans, the demand picture for Nvidia changes faster than the current analyst models reflect.
One setup. One 15-minute window. Done by 10 AM.
It’s called the “Opening Bell Breakout” – the same strategy behind moves like 113% on GOOGL and 240% on META. I put the full setup into a short, free guide you can start using tomorrow morning.
Forward Outlook: What Comes After August 26
The architecture cadence that Jensen Huang laid out at GTC 2026 in March is unambiguous: Blackwell Ultra is ramping now, Vera Rubin ships in H2 2026, Rubin Ultra arrives in 2027, and Feynman follows in 2028. An annual architecture refresh cycle, delivered on schedule, creates a compounding upgrade cycle that pressures hyperscalers to commit capital ahead of availability or risk falling behind competitors who did. That dynamic is what Jensen Huang called a signed order book of $1 trillion in committed orders through 2027. That figure is not aspirational. It is forward contractual demand.
The medium-term financial model is equally specific. The 52-week price range of $164.07 to $236.54 frames a stock that is 9.2% off its highs at the August 21 close of $214.72. The analyst consensus 12-month price target near $303 to $305 implies approximately 40% upside from current levels. UBS projects non-GAAP EPS above $15 for fiscal 2027 and above $20 for fiscal 2028. Those estimates depend on gross margins holding in the mid-70% range and on Rubin volume ramping as confirmed at GTC Taipei. August 26 is the first real checkpoint against both assumptions.
The longer arc is also worth keeping visible. The four hyperscalers alone are committing $725 billion to AI infrastructure in 2026, and analysts project combined capex topping $1 trillion in 2027. That is not a capital cycle that reverses on a single earnings miss. The structural demand for AI compute at scale is a multi-year commitment underwritten by the competitive economics of every major technology company on the planet. Nvidia’s Q2 FY2027 report is a checkpoint, not a verdict. What it tells traders is how cleanly the Rubin transition is executing, whether the margin story holds during a platform ramp, and whether management’s forward visibility remains as confident as it has been for eight consecutive quarters.
Every earnings cycle, the instinct is to simplify the Nvidia trade into a binary: does it beat or miss? That framing has been wrong for four consecutive quarters. The company beat in all four. The stock fell in all four. The trade is not the Q2 revenue number. It has not been the revenue number for more than a year.
What August 26 is actually testing: whether the Q3 guide clears $100 billion, whether gross margins hold through a platform transition that introduces real cost pressure, and whether Vera Rubin’s production ramp is on a trajectory that justifies the forward EPS estimates that underpin a $303 consensus price target. Those are the three data points that determine whether the post-earnings reaction breaks the four-quarter losing streak or extends it.
Preparation is the only edge available before a known binary event. That means knowing your scenario, knowing your structure, knowing your levels, and knowing where the trade is wrong before it is placed. The market will provide the answer after the close on August 26. The work of a disciplined active trader is to have the framework ready before it does.
The AI demand case does not rest on one quarter. $725 billion in committed hyperscaler capex for 2026 alone closed that debate. What August 26 tests is execution: margins, Rubin timing, and the forward guide. Get the framework right before the close. The result takes care of the rest.
For informational and educational purposes only. Not investment advice. Trading involves risk, including loss of principal.