
October 25, 2026
Bonus Content: Samsung’s $80 Billion Quarter Gets Details Thursday
Quick reminder.
Your free copy of The 0DTE Game Plan is still sitting there, ready to download.
But the link won’t work forever.

Once it expires, the report goes back to $29.97 on our website.
So do yourself a favor and download it right now. Save it to your computer, and it’s yours to keep no matter what it costs later.
It takes about 10 seconds.
Inside, you’ll find the simple 3-step plan for trading same-day options like a business: Plan it. Profit from it. Protect it.
Make sense?
Click here to download The 0DTE Game Plan before your link expires.
Good Trading,
Bill Poulos
p.s. Free today, $29.97 once this link is gone. Grab your copy here.
Samsung’s $80 Billion Quarter Gets Details Thursday
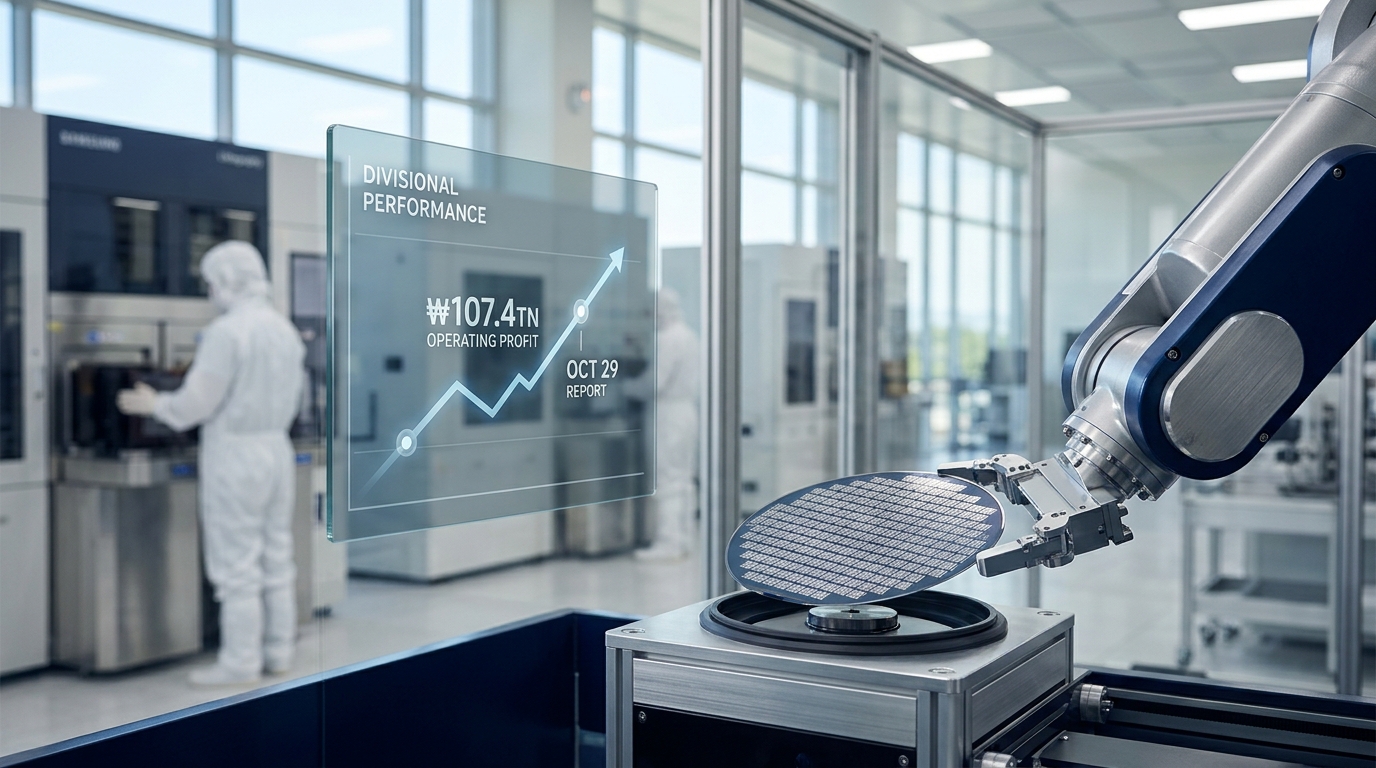
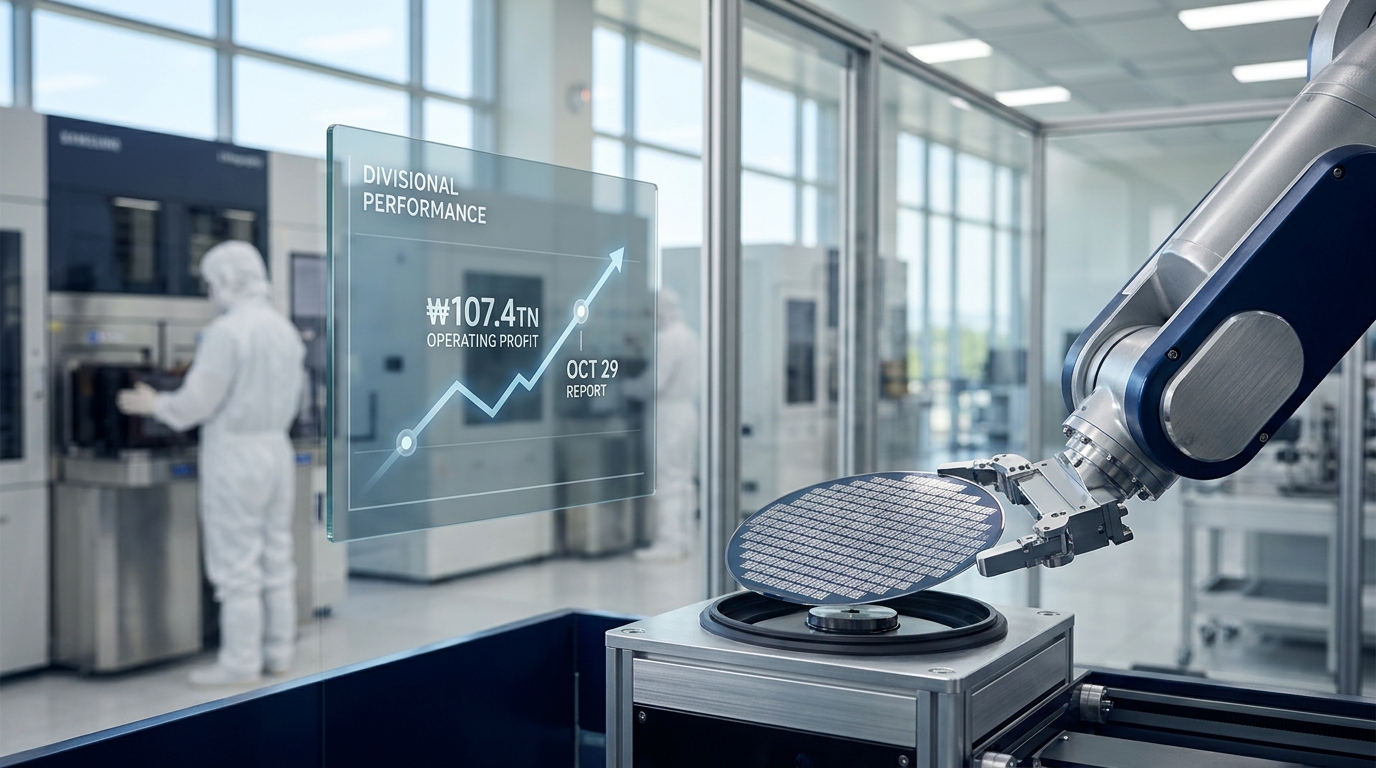
Samsung Electronics reports full Q3 2026 results on Thursday, October 29, and for the first time since the October 8 preliminary guidance, investors will see how ₩107.4 trillion in operating profit was actually distributed across the company’s divisions. That one disclosure, arriving the day after SK Hynix reports its own quarter, carries more weight than usual. The memory complex has shed roughly $1 trillion in combined market value since early October, and the divisional breakdown is the single data point that can tell traders whether record DRAM and NAND pricing is being banked or competed away.
What the Preliminary Number Said – and What It Hid
₩107.4 trillion. That is up sharply from a year ago. The preliminary figure marks the first time Samsung has posted quarterly operating profit above ₩100 trillion in a single quarter. Revenue hit ₩195 trillion, up 126.6% year over year. The operating margin climbed to about 55.1% from about 14.1% a year earlier.
The problem: Korean preliminary filings carry no divisional detail. The preliminary results exclude divisional performance and net income; the October 29 report should provide greater clarity on semiconductor profitability, manufacturing costs, and the Q4 outlook. In Q2, Samsung’s Device Solutions division earned ₩89.2 trillion in operating profit, out of ₩89.5 trillion for the company in total. The semiconductor unit effectively was the company. Analysts expect Q3 to show a similarly wide gap.
Where the Divisions Are Likely to Land
Memory chips are widely seen as the main driver behind the record operating profit. Analysts estimate the memory business alone generated around ₩100 trillion-plus in operating profit. The contribution of HBM4 sales for Nvidia’s next-generation Vera Rubin AI platform is widely believed to be reflected in Q3 earnings.
The consumer side is a different story. The DX division, which recorded an operating loss of roughly ₩800 billion in Q2, is estimated to have widened that loss beyond ₩1 trillion in Q3. The foundry unit is also expected to remain in the red. The chip boom has not benefited all of Samsung’s businesses equally; its mobile unit is estimated by some analysts to have remained loss-making, while the foundry division is also projected to stay in the red.
The Market Context Traders Cannot Ignore
005930 closed at ₩215,500 on October 23, down from a 52-week high of ₩374,500 reached earlier in 2026. A global selloff in semiconductor stocks dragged South Korea’s benchmark down sharply mid-month, as investors retreated from AI-exposed names. Worries over Federal Reserve rate hikes and AI funding difficulties drove SK Hynix and Samsung down more than 9% each on October 15. The Kospi has fallen about 21% from its September high.
Both companies’ stocks fell following reports that the latest advances by China’s ChangXin Memory Technologies could increasingly challenge Samsung, SK Hynix, and Micron. That fear may be premature. CXMT has published no yields, no capacities, no shipping date beyond “before the end of 2026,” and no independent verification of its claim. Yet the market priced it as fact.
The U.S. complex followed. SanDisk, still up 429% year to date, dropped 8% on October 22 to $1,262. Western Digital fell 7% to $351.77 and Micron slid 6% to $860.97 in the same session. SK Hynix reports October 28, one day before Samsung’s full call.
What the Pricing Data Actually Shows
Micron’s fiscal Q3 2026 report, delivered in late June, remains one clean empirical read on the cycle. Revenue came in at $43.6 billion, adjusted EPS hit $25.11, and non-GAAP gross margin was about 80%. Micron guided Q4 2026 revenue to $50 billion, plus or minus $1 billion. That guidance, issued months before this selloff, still implies sequential acceleration.
Rate pressure is the other variable traders cannot ignore. Memory stocks rallied into rising Fed hike odds, signaling that fundamental demand can override the rate discount.
On pricing itself: Samsung’s Q3 DRAM and NAND average selling prices are projected to have risen around 20% and 17%, respectively, with the memory division driving overall performance. TrendForce forecasts Q4 2026 contract-price increases of 10-15% for conventional DRAM and 15-20% for NAND flash. The supply shortage is not theoretical. On Samsung’s Q2 earnings call, management said it expects the shortage to persist through 2028, with supply conditions more severe in 2027 than in 2026, reinforcing the view that shortage conditions could persist.
Scenario Modeling
Bull Case
Thursday’s call confirms Device Solutions generated ₩105 trillion or more in operating profit, HBM4 revenue mix exceeded 60% of total HBM sales as guided, and Samsung raises Q4 pricing guidance for both DRAM and NAND. KB Securities expects HBM prices to rise more than 100% in 2027, with HBM4 accounting for around 80% of Samsung’s HBM sales versus roughly 40% in 2026. That path reopens for 005930 toward the 36-analyst consensus target of ₩478,906, implying more than 100% upside from current levels. MU, SNDK, and SK Hynix sympathy-rally.
Base Case
Device Solutions posts ₩100-108 trillion in operating profit. Mobile losses slightly widen but remain manageable. Foundry remains loss-making. Samsung guides Q4 cautiously, citing won strength. A stronger South Korean won has weighed on expectations; a stronger currency reduces the value of overseas sales converted back into won, and the won has gained nearly 9% against the dollar this year. 005930 stabilizes near ₩210,000-230,000 and the complex trades on SK Hynix’s divisional detail rather than re-rating materially higher.
Bear Case
HBM4 ramp disappoints, mobile losses widen past ₩2 trillion, or management signals Q4 pricing pressure. Samsung shares declined 2.42% following the October 8 preliminary announcement as investors questioned whether elevated memory-chip prices and semiconductor profit margins could be sustained. A guidance miss would confirm those concerns, pushing 005930 toward the ₩200,000 level and extending the selloff in MU, SNDK, and WDC.
Active Trader Framework
Thursday’s call is binary for the chip complex. Three levels matter for 005930: ₩203,500 (October 23 intraday low and near-term support), ₩215,500 (recent close and resistance), and ₩232,000 (where Samsung traded before the October 13 break). Recovery through that level would change the technical picture substantially.
For U.S.-listed names, the setup is asymmetric: MU, SNDK, and SK Hynix saw premarket buying on October 23 after Thursday’s sharp sell-off, suggesting short-term oversold conditions. But positioning into the Samsung and SK Hynix calls carries event risk in both directions. Volatility around divisional disclosure tends to be sharper than after preliminary figures, because the margin and mix detail is where the real argument lives. Sizing matters more than direction here. Manage notional exposure accordingly, and keep dry powder for the reaction rather than the anticipation.
Preparation, not prediction, is the edge. The numbers arrive Thursday. Be ready for both outcomes.