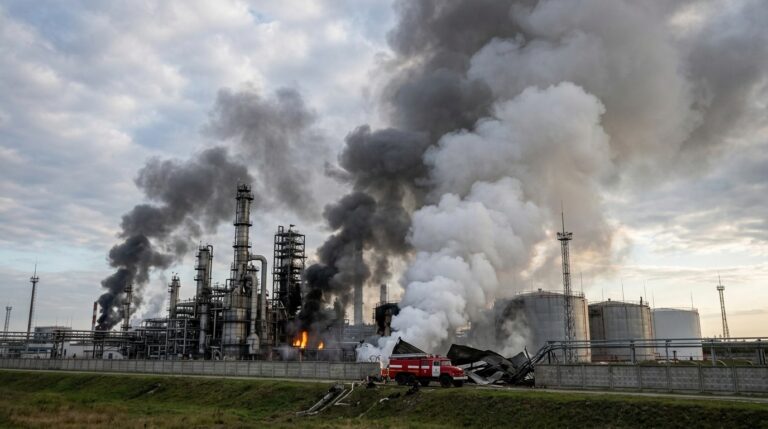
Let’s be honest about where we are: the global energy market just absorbed one of the most disruptive geopolitical shocks in modern history, and the full repricing still hasn’t worked its way through equity markets.
The World Bank’s Commodity Markets Outlook released April 28 didn’t bury the headline — energy prices are projected to surge 24% in 2026, the largest increase since Russia’s invasion of Ukraine in 2022. Overall commodity prices are forecast to rise 16%. Brent crude is expected to average $86 a barrel this year, up sharply from $69 in 2025. And that’s the baseline — assuming the most acute Strait of Hormuz disruptions ease by May and flows normalize by late 2026. That’s a generous assumption given current conditions.
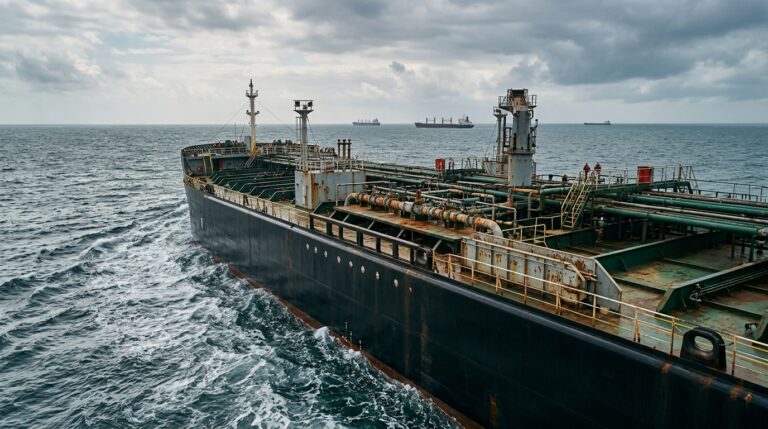
As of the April 29 close, WTI traded above $102 a barrel. Brent was above $110 for the first time in three weeks. The ceasefire announced earlier in April did not hold — Iran reimposed tighter control over the Strait within hours of nominally reopening it, with reports of gunfire on tankers. A second round of U.S.-Iran talks is underway in Islamabad, but the market is no longer treating diplomatic headlines with much conviction.
The Supply Picture
The IEA put out data that is hard to look away from. In early April, Strait of Hormuz shipments were running at roughly 3.8 million barrels per day — compared to more than 20 million barrels per day in February before the conflict began. That’s not a partial disruption. That’s a near-complete shutdown of the world’s most critical energy transit corridor. Global oil supply plummeted by 10.1 million barrels per day in March alone, the largest disruption in history, with OPEC+ production falling 9.4 mb/d month-over-month.
Slight tangent worth noting: the World Bank also flagged that fertilizer prices are projected to jump 31% in 2026, driven by a 60% spike in urea prices. Markets tend to underestimate the agricultural commodity read-through from energy disruptions until it shows up in food inflation data six to twelve months later. That’s a risk layer traders aren’t fully pricing into the macro framework yet.
Saudi Arabia and the UAE have been rerouting crude through alternative pipelines — output flowing through those channels increased from under 4 mb/d pre-war to 7.2 mb/d by early April. It’s meaningful relief, but the math still doesn’t close the gap. Goldman Sachs has warned Brent could average over $100 per barrel through 2026 if the Strait remains restricted. The World Bank’s stress scenario puts Brent averaging as high as $115 if critical facilities suffer additional damage.
Who Actually Wins This Trade
U.S. energy producers are the structural beneficiaries of this entire dislocation. The Iran conflict has highlighted what the Permian Basin already proved years ago: low-cost, onshore, domestically produced barrels with zero exposure to maritime transit risk are exactly what global refiners want right now. Pioneer Natural Resources (acquired by Exxon), Diamondback Energy (FANG), and Coterra Energy (CTRA) represent that basin’s public market exposure.
The integrated majors — ExxonMobil (XOM) and Chevron (CVX) — have been the institutional go-to. Both raised dividends 4% earlier this year while beating Q4 earnings estimates. Free cash flow yields at current oil prices sit in the 8–12% range for both companies, well above market averages. Citi recently upgraded Clean Harbors (CLH) to Buy with a $346 price target, noting the environmental services giant posted record revenue of $6.03 billion in 2025 and achieved 15 consecutive quarters of margin expansion — that’s an indirect energy infrastructure play that isn’t on most screens.
Technical and Volatility Framework
Energy sector ETFs (XLE, XOP) have been in a complex range since oil prices pulled back from their $120 peak in early March. The sector is consolidating gains rather than breaking down, which is characteristic of a mid-cycle energy trade rather than a momentum collapse. Crude itself — WTI specifically — has the $98 area as near-term support, with $115 as the overhead target if the ceasefire framework deteriorates further.
Oil volatility (OVX) has been running well above its historical average. That creates two-sided opportunities for active traders: mean reversion plays when oil spikes on headlines, and structural long setups in quality producers when energy stocks lag the commodity on geopolitical relief moves (which they consistently have in this cycle).
PCE and GDP data dropping April 30 will matter for the macro context — if core inflation continues rising, the Fed’s ability to cut rates narrows, which historically has supported commodity-linked equities relative to long-duration growth.
Three Scenarios
Bull Case: Strait of Hormuz negotiations collapse. A new escalation event drives Brent above $120 again. XOM, CVX, FANG, CTRA all break to new 52-week highs. Energy becomes the dominant sector rotation trade through Q3 2026. Natural gas producers see sympathy bids as LNG remains constrained.
Base Case: A fragile, partial reopening of the Strait takes hold by mid-May. Oil stabilizes in the $90–$105 range. U.S. producers generate substantial free cash flow at those levels, support buybacks and dividends, and the sector holds relative outperformance without another major breakout. Macro drag from elevated energy costs starts showing up in consumer discretionary earnings by Q3.
Bear Case: A durable ceasefire accelerates Strait reopening and Middle East supply returns faster than expected. Brent drops toward $75–$80. Energy equities reprice lower, particularly the smaller Permian operators with leveraged balance sheets. Integrated majors hold better on dividend support, but the sector rotation into energy reverses aggressively.
Active Trader Positioning Considerations
The risk/reward in this trade depends heavily on what you believe about the ceasefire trajectory — and that’s a function of geopolitical intelligence, not technical analysis. What technicals can tell you is where the risk points are: a sustained close below $95 WTI would shift the short-term structure, while a close above $112 Brent likely triggers institutional momentum chasing in the sector.
Don’t ignore the defense and aerospace read-through here either. Morgan Stanley has explicitly flagged defense, security, and aerospace as multi-year demand stories driven by the same geopolitical backdrop. That sector thesis doesn’t require oil prices to stay elevated — it just requires governments to keep spending, which they are.
The energy trade isn’t a binary event. It’s a multi-month positioning exercise with real volatility on both sides. Discipline on entry levels and position size is the edge — not the macro call itself.
For informational and educational purposes only. Not investment advice. Trading involves risk, including loss of principal.