June 8, 2026
Bigger than Nvidia? Louis Navellier Thinks So
Featured: High-Yield Outflows Are Landing in Copper
Editor’s Note: In 2016, our friend Louis Navellier recommended Nvidia at $2.51 – split-adjusted. It went up 44,000%. He also called Apple before a 36,000% rise and Microsoft before a 60,800% climb. Now he says a new AI device coming online in Tennessee is the setup for the biggest call of his career. He’s agreed to reveal the stock at the center of it – down to the ticker – for free.
Dear Reader,
In 2016, I sent my readers a simple recommendation.
Buy Nvidia… at $2.51, split-adjusted.
What happened next is now Wall Street legend.
Nvidia went up 44,000%.
The investors who acted made life-changing money.
Those who didn’t have been watching from the sidelines ever since.
I’m writing today because I believe history is setting up to rhyme.
Right now, behind a razor-wire fence in the mountains of Tennessee…
At the same secretive government lab that built the atom bomb in 1945…
American scientists are completing work on a new AI computer called “Golden Dawn.”
Golden Dawn will be 283 trillion times more powerful than today’s leading data centers.
It will span more than 700 miles – larger than the state of Texas.
And it will accelerate AI breakthroughs by 36,000% – turning a five-year timeline into five days.
When it launches, it will instantly leapfrog every AI model on earth: ChatGPT, Gemini, Grok.
And it will trigger what I’m calling a $100 trillion reset of the AI markets.
I’ve identified one company – still relatively unknown, just as Nvidia was in 2016 – that I believe is best positioned for what’s coming.
I’m revealing it, down to the ticker, in a new free presentation.
This is the biggest prediction of my 40-year career.
But you must act now – before May 5th.
Click here to watch it now, free of charge.
Regards,
Louis Navellier
Senior Quantitative Investment Analyst, InvestorPlace
P.S. My readers who got into Nvidia at $2.51 – split adjusted – didn’t need another winner. They were set. I believe “Golden Dawn” is a similar setup – a little-known company, a massive technological shift, and a narrow window to act before the crowd catches on. Go here for the full details, including the ticker – before May 5th.
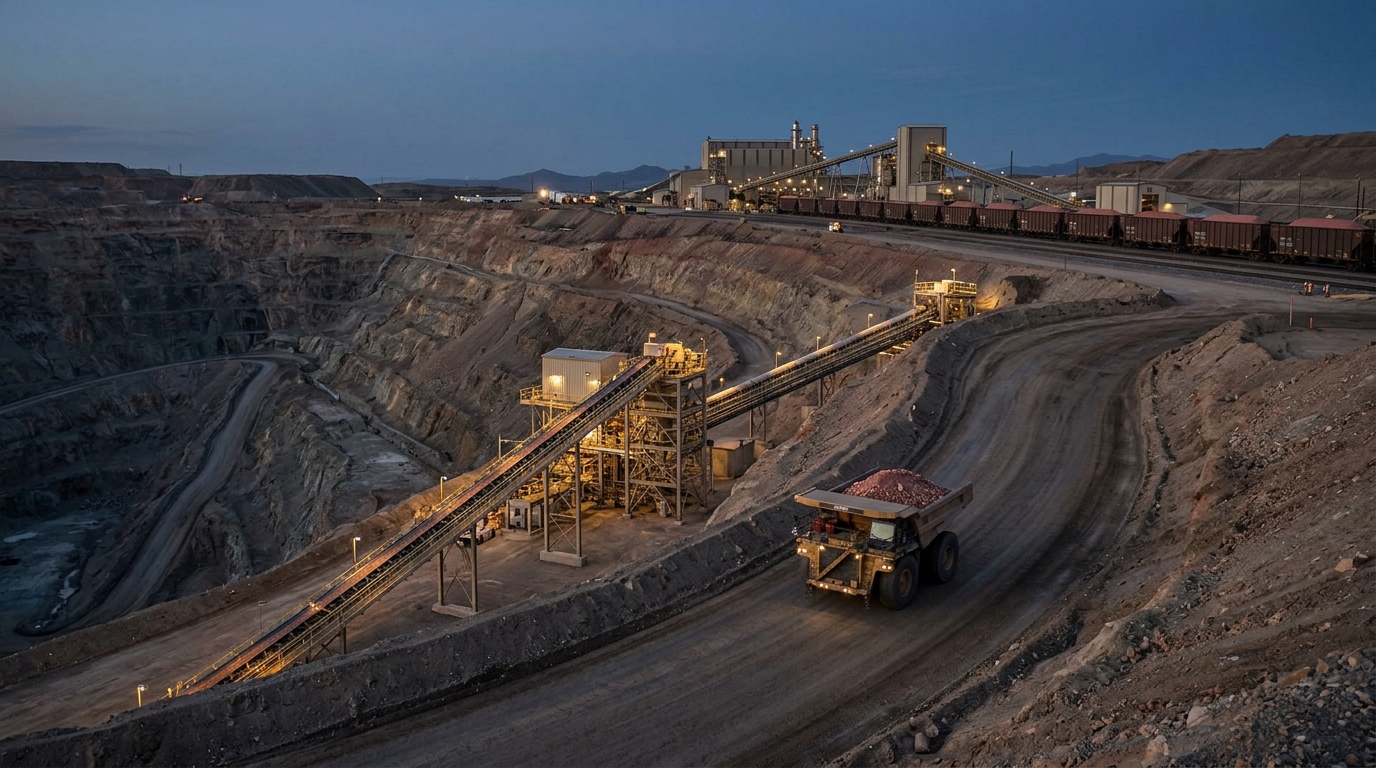
High-Yield Outflows Are Landing in Copper
Core inflation is not cooperating.
The St. Louis Fed’s own data put core PCE at 3.1% as of January 2026, with services inflation ex-housing holding above 3% and showing no meaningful deceleration. The Philadelphia Fed’s Q4 2025 Survey of Professional Forecasters revised inflation projections for 2026 and 2027 upward from the prior survey. The FOMC is holding the policy rate at 3.50%–3.75%. That’s the environment. Fixed income is getting squeezed from both sides, and the high-yield compression trade that worked in 2023 and early 2024 has largely run its course.
What’s interesting is what’s happening downstream from that. Institutional asset managers, particularly those running tactical growth sleeves, are not sitting in cash. They’re moving into physical commodity exposure. Copper, specifically, is absorbing a meaningful portion of that flow. And Freeport-McMoRan (NYSE: FCX) remains the most direct large-cap vehicle to express that positioning.
The Copper Market Right Now
Copper is trading at approximately $6.32 per pound as of June 8, 2026 – up roughly 29% year-over-year. That’s not a rounding error. The LME contract opened 2026 near $12,469 per metric ton. J.P. Morgan’s commodities research projects a full-year 2026 average near $12,075 per metric ton and forecasts a refined copper market deficit of approximately 330,000 metric tons this year. Goldman Sachs, taking a more measured view, expects LME copper to hold in the $10,000–$11,000 range, supported by grid and power infrastructure investment. Even the conservative case keeps copper well above historical averages.
The structural argument is not complicated. Electric vehicles use approximately four times more copper than conventional internal combustion vehicles. Renewable energy infrastructure requires roughly three tonnes per megawatt of wind capacity. AI data center expansion in the U.S. alone is projected to add 50 gigawatts of capacity by 2028. BloombergNEF’s December 2025 Transition Metals Outlook warned that copper demand for the energy transition could triple by 2045 and that the metal may enter a structural deficit as early as 2026. BHP has forecast copper demand growth of approximately 70% to over 50 million tonnes annually by 2050.
Supply is not keeping pace. Mine disruptions in Chile, Indonesia, and Peru, combined with slow permitting timelines and a weak pipeline of new projects, are compressing the available supply buffer. Refinery treatment and refining charges have collapsed toward zero globally – a direct signal of concentrate tightness. The World Bank’s base metal price index is expected to rise in 2026–2027, with copper and tin projected to reach new nominal record highs given persistent supply constraints.
The Rare Earth Stock Boom: Even Bigger Gains Could Hit Soon
Tiny rare-earth miners are exploding: 200%, 300%, even 500% gains in just months. But while everyone piles into the same names, I’ve uncovered the next wave of this $3 trillion resource story...a breakthrough that could make today’s miners obsolete. I’m expecting the big announcement any day now.
FCX: What the Numbers Actually Show
Freeport-McMoRan is one of the world’s largest publicly traded copper producers. Its asset base spans the Grasberg minerals district in Indonesia, Morenci, Cerro Verde in Peru, El Abra in Chile, and multiple U.S. operations across Arizona and New Mexico. The scale matters. Few competitors can replicate the combination of reserve life, production volume, and geographic diversification that FCX carries.
Q3 2025 revenue came in at $6.97 billion, exceeding analyst expectations. Q4 2025 revenue was $5.63 billion, beating consensus by approximately 9%. Full-year 2025 operating cash flow totaled $5.6 billion against capex of $3.9 billion. Adjusted EBITDA for Q1 2025 landed at $1.9 billion. Q3 2025 adjusted EPS was $0.50, $0.09 ahead of the $0.41 consensus estimate. Q4 2025 adjusted EPS came in at $0.47, a 68% beat versus the $0.28 estimate. The company ended 2025 with approximately $4.3 billion in cash. Net debt remains below management’s internal target range of $3–$4 billion. FCX returned $5.7 billion to shareholders through dividends and buybacks across full-year 2025.
Slight tangent worth noting: FCX’s leaching and technology innovation initiatives generated 56 million pounds of incremental copper in Q3 2025 alone, with 154 million pounds year-to-date through that quarter. Management is targeting 300 million pounds of annual production from these initiatives in 2026. That’s not a side project. That’s a margin lever that most commodity producers don’t have access to at this scale.
For Q1 2025, FCX guided to 850 million pounds of copper sales. Actual Q1 output came in at 872 million pounds. The full-year 2025 copper sales guidance was 4.0 billion pounds, with gold at 1.6 million ounces. Average realized copper price for Q1 2025 was approximately $4.44 per pound versus the LME average of $4.24. Average realized copper price for 2025 full-year surged roughly 28% year-over-year to $5.33 per pound. That kind of price leverage directly flows through to margins at FCX’s production scale.
On the risk side: Grasberg production guidance was cut to 60,000 tons per day in H2 2026 from 100,000, implying roughly 9% copper and 7% gold output reductions through 2031. Grasberg output recovery is now expected by mid-2027. That’s a real headwind. Management acknowledged the challenge on Q1 2026 earnings. Capital intensity remains elevated through 2027, which constrains near-term free cash flow flexibility even with strong EBITDA generation. And at a trailing P/E of approximately 45x and a market cap around $92–$98 billion, the valuation already embeds a degree of the long-term copper bull case.
Analyst Positioning
Current analyst consensus across 30 Wall Street analysts carries a median 12-month price target of $70.00, with the high at $81.00. FCX is trading near $63–$68. Wells Fargo carries a $77 target as of April 2026. UBS raised its target to $75. Deutsche Bank moved to $72. Barclays initiated with an Overweight in May 2026. Citigroup maintained Buy with a $66 target. Morgan Stanley moved to Equal Weight with a $66 target, citing near-term Grasberg uncertainty while acknowledging the long-term asset quality. Among 30 analysts tracked: 19 Buy, 2 Hold, 1 Sell. That’s a relatively clean skew, even with the production guidance cut hanging over the stock. Forecast EPS for 2026 centers around $2.95, with the high-end case at $5.17. Earnings growth of approximately 41.5% is forecast for FCX in 2026, ahead of both the copper industry average and the broader U.S. market forecast. FCX’s revenue growth forecast of approximately 11.7% also outpaces the copper sector’s 7% average.
Technical Structure Worth Watching
FCX has been trading near the top of its 52-week range and above its 200-day simple moving average. The stock traded as high as $52.29 in December 2025 before the copper price rally and earnings beats pushed it materially higher into 2026. Volume patterns around the Q1 2026 earnings beat showed institutional accumulation characteristics. Key technical levels to monitor: the $60 zone as near-term support, the $72–$75 range as the next resistance cluster where multiple analyst targets converge. A break and hold above $75 on volume would shift the medium-term structure meaningfully. A failed hold of $60 on elevated volume, particularly if accompanied by a Grasberg update, would be worth watching as a signal of deteriorating sentiment.
VWAP-anchored positioning from the Q1 2026 earnings reaction remains elevated, suggesting the market is not yet pricing in significant downside from the Grasberg production revision. That may change if mid-2027 recovery timelines slip further.
Three Scenarios
Bull Case: Copper holds above $6.00 per pound through H2 2026. Grasberg ramp-up stabilizes toward the mid-2027 timeline without further slippage. Leaching initiatives hit or exceed the 300 million pound target. Core inflation remains elevated but the Fed stays on hold, keeping rate-sensitive capital flowing into real assets. FCX earnings outperform the $2.95 consensus EPS estimate. Price moves toward $77–$81 analyst targets. The Grasberg licence extension provides positive NAVPS impact, as analysts have flagged.
Base Case: Copper trades in the $5.50–$6.50 range. Grasberg production remains constrained through mid-2027 as guided. FCX delivers earnings in line with the consensus $2.95 EPS range. The stock consolidates in the $63–$72 band. Institutional flows into copper remain steady but not accelerating. The Grasberg production cut weighs on near-term sentiment while the long-term asset quality keeps a floor under the stock.
Bear Case: Chinese demand weakens materially – copper consumption in China fell approximately 8% year-over-year in Q4 2025, and a further deterioration from the property sector would compress the demand side of the equation. Copper breaks below $5.00 per pound. Grasberg timelines slip again, triggering further estimate cuts. Operating costs rise on elevated diesel prices. FCX earnings miss consensus. The stock tests $50–$52 support. The bear case is real but requires multiple factors moving simultaneously in the wrong direction.
Here’s the Best Day to Buy Nvidia
Did you know Nvidia has a 93% history of soaring, beginning on one particular day every single spring?
We call this the “Green Day phenomenon.” It works on 5,000 stocks.
For example, Amazon has a 100% history of soaring beginning on one particular day every single year.
Positioning Framework for Active Traders
FCX is not a low-volatility position. Commodity price swings, geopolitical risk across Indonesia, Peru, and Chile, and capital intensity through 2027 all generate meaningful price variability. Traders monitoring this name should have clear levels defined before entering. The $60 area represents a logical risk reference for long-biased positioning. Sizing should account for copper’s tendency toward 30–50% drawdowns in downturn cycles.
The institutional rotation thesis is real, but it is not a straight line. Copper is 29% higher year-over-year. Some of that move reflects structural demand, some reflects tariff-related front-running, and some reflects the AI and energy transition premium that has been bid into the commodity complex. Traders who separate those three components will have a sharper view of which part of the current price is durable and which is vulnerable to mean reversion.
Volatility expectations should remain elevated given the Grasberg uncertainty, Middle East geopolitical dynamics affecting copper refining logistics, and pending U.S. copper tariff decisions expected from the Commerce Secretary. Goldman Sachs estimates a refined copper tariff of at least 25% could be implemented shortly after the Commerce Secretary’s recommendation, potentially accelerating inventory builds into U.S. warehouses. That creates short-term price distortions that are worth understanding before trading around them.
What remains true is this: FCX is carrying one of the most relevant operational profiles in the current macro environment. The confluence of sticky inflation, institutional de-risking from fixed income, and structurally tightening copper supply gives the stock a different kind of relevance than it had in prior cycles. Whether the next move in FCX is $72 or $52 will largely depend on factors outside the company’s direct control. But the asset base, the production scale, and the leverage to copper prices make it a position worth understanding in detail.
Preparation is the edge. Not prediction.
For informational and educational purposes only. Not investment advice. Trading involves risk, including loss of principal.