July 22, 2026
The $3.3 Trillion Chip Wipeout Is Funding the Healthcare Comeback. Here’s What That Trade Looks Like Right Now.
UNH just printed a 30% EPS beat and raised guidance. The semiconductor sector has erased $3.3 trillion in value since June 22. The rotation isn’t a rumor anymore — it’s in the tape.
Worst News for Stocks in 50 Years
Wall Street’s declared what could be the worst news for the U.S. stock market in 50 years.
If Goldman Sachs and Morgan Stanley are right… this won’t be like the crashes we’re used to. What’s about to hit America next could keep your portfolio in the red for 10 years or longer – unless you make a big change now.
To hear about this decade-long crisis now being predicted by multiple Wall Street banks…
And to see what you can do to prepare your wealth before this hits…
Click here to learn how to defend your portfolio.
Regards,
Keith Kaplan
CEO, TradeSmith
P.S. You may have noticed we see “surprise” crashes every year now. Think about it: rate spikes in 2022… the bank crisis in 2023… $8 trillion wiped out in 2024… $11 trillion wiped out during the tariff crash in 2025… and, this year, $12 trillion was wiped out in 30 days during the Iran War. Something is off and Wall Street suggests this could continue (and worsen) well into the 2030s. Click here to learn the truth about this market and see what you must do now to prepare.
Something shifted this week, and it’s not subtle.
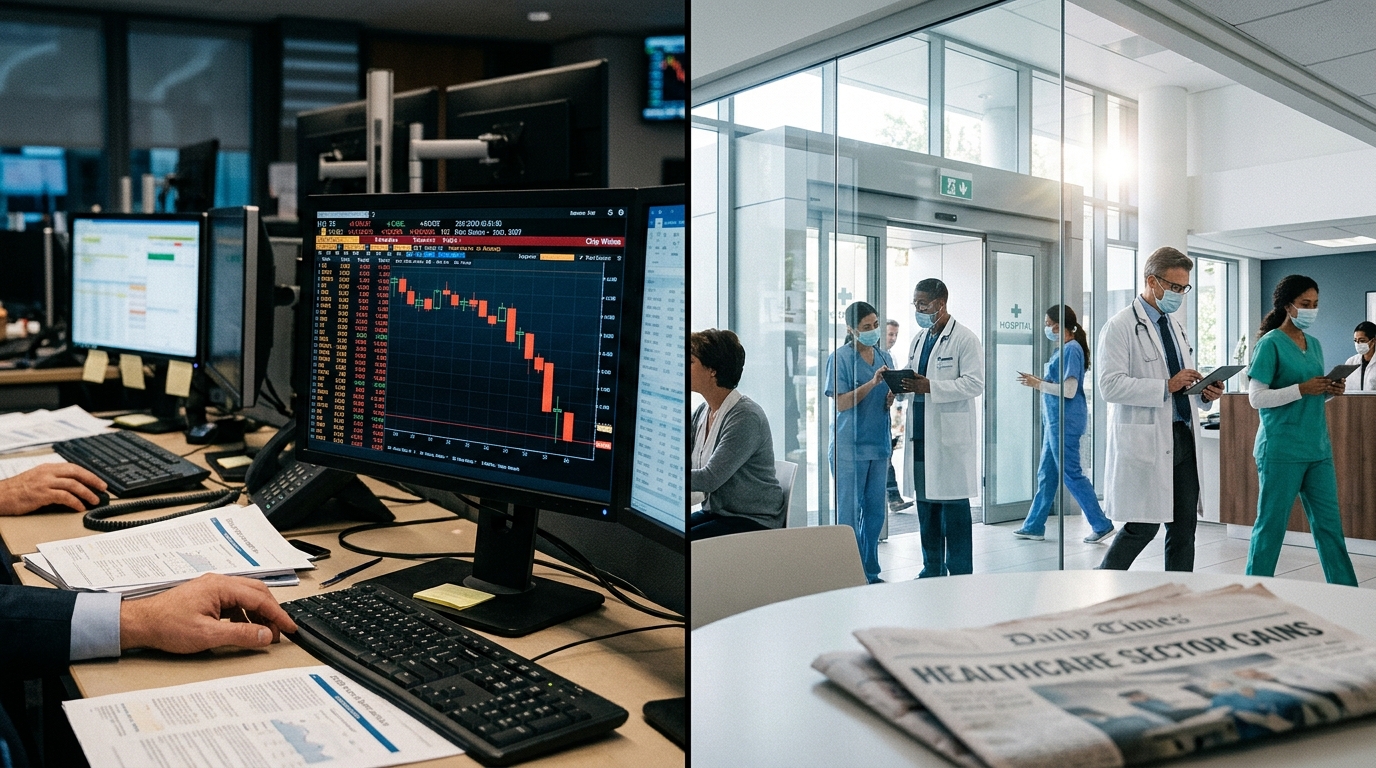
While the semiconductor complex continued its ugly descent — the iShares Semiconductor ETF (SOXX) down nearly 3% in Friday’s premarket alone — the Healthcare Select Sector SPDR (XLV) surged 2.22% on Thursday, its single best session in weeks. Consumer Staples (XLP) added another 1.5%-plus. Eight of eleven S&P 500 sectors closed higher on July 16, even as the Nasdaq 100 shed 1.5%. The Equal-Weight S&P 500 hit a fresh all-time high. That’s not a broad market sell-off. That’s a rotation — and one that’s been accelerating faster than most positioning models anticipated.
The chip sector has now erased roughly $3.3 trillion in market value since June 22, driven by a convergence of valuation anxiety, Chinese AI competition, and growing investor skepticism about the pace of return on AI infrastructure outlays. At the same time, the capital that’s leaving growth has to land somewhere. Right now, a significant portion of it is landing in healthcare — specifically in managed care, which just got a very loud fundamental confirmation.
UNH: The Number Behind the Rotation
UnitedHealth Group (UNH) reported Q2 2026 results on Thursday morning that weren’t just a beat — they were a reframing of what the managed care recovery story actually looks like.
Adjusted EPS came in at $6.38, against a consensus of $4.92. That’s a 30% beat on the bottom line. Revenue hit $112.03 billion, slightly above the $110.86 billion Wall Street had expected. Net income rose to $5.48 billion, compared with $3.41 billion in the year-ago quarter — a 61% increase in absolute dollar terms. The company then raised full-year 2026 adjusted EPS guidance to $19.50–$20.00 per share, up from its prior guidance of more than $18.25. Management also guided for approximately $24 billion in operating cash flow for the year and plans to repurchase at least $5 billion in shares.
The number the market cared about most, though, was the Medical Care Ratio.
UNH’s MCR — the percentage of premium revenue spent on actual healthcare claims — came in at 86.7%, down from 89.4% a year earlier. Analysts had modeled 88.47%. That 170+ basis point beat on the MCR is enormous at UnitedHealth’s scale. Every 10 basis points of MCR improvement translates to approximately $110 million in operating income at current revenue levels. The Q2 result wasn’t just good. It was the clearest evidence yet that the managed care industry’s cost spiral has been brought under control.
Shares jumped roughly 6–7% in premarket Thursday and continued higher through the session. The 52-week range prior to earnings: $234.60 to $434.30. The stock has now staged a 73% recovery from its August 2025 cyclical low — yet it still trades below its prior peak, and analysts immediately went to work raising targets.
Bank of America moved to $512 from $475. Truist raised to $480 from $440. Morgan Stanley had raised its target to $468 (from $375) ahead of the report. The wave of upgrades was near-unanimous — and notably, several targets imply meaningful additional upside from current levels even after Thursday’s pop.
What Drove the Beat — And Why It Holds
The Q2 improvement wasn’t a one-time artifact. There were three structural drivers behind UNH’s quarter.
First, Optum. The company’s health services arm generated Q2 revenues of $65.7 billion and earnings from operations of $4.0 billion, representing 160 basis points of margin expansion year-over-year. Optum supported more than 120 million consumers in the quarter. This unit — which includes Optum Health, Optum Insight, and Optum Rx — continues to grow faster than UnitedHealthcare’s insurance book and is increasingly viewed as the structural growth engine within the broader enterprise. Management has guided Optum’s operating earnings north of $25 billion for the full year.
Second, pricing discipline. UnitedHealthcare served 48.5 million members in the quarter, down 525,000 from the prior quarter as the company continued strategically shedding lower-margin lives. Premium increases were large enough to keep total revenue essentially flat year-over-year despite the member count decline. That’s the discipline the market had been waiting to see confirm: UNH is choosing margin over volume, and it’s working.
Third, AI and technology investments are beginning to show up in cost structure. Management explicitly cited “modern technology” as a contributor to operational improvement. Morgan Stanley named UNH its top managed care pick ahead of the print, citing AI-driven efficiency gains as a component of the earnings recovery thesis. This is a theme that will likely deepen over the next several quarters as the technology build-out matures.
Management also reiterated a long-term target of 13% to 16% annual earnings growth — a target that looks more credible after two consecutive earnings beats and a guidance raise. The company has raised its dividend for 16 consecutive years; the current yield sits near 2.1%–2.2%, a meaningful support level for institutional holders rotating out of zero-yield growth stocks.
The Macro Picture Behind the Rotation
Here’s where it gets interesting. UNH didn’t just benefit from its own operational execution. It benefited from a macro moment that was tailor-made for defensive sector outperformance.
The S&P 500 closed at 7,533.77 on Thursday, down 0.5% on the session. U.S. yields rose and oil prices finished modestly lower on the day after erasing an earlier gain. June CPI came in at 3.5% year-over-year, below the 3.8% consensus — a softening print that typically supports interest rate-sensitive and defensive sectors.
Meanwhile, capital outflows from growth and tech funds accelerated. According to one market data provider, investors withdrew $7.18 billion from growth funds and allocated $3 billion to value funds in recent sessions — the kind of flow data that tends to self-reinforce once it starts.
The XLV/SPY relative strength ratio recently printed one of its sharpest weekly improvements on record — a +4.63 standard deviation reading that the framework hadn’t generated in either direction in over twelve months. Healthcare companies have historically beaten the S&P 500 in more than 75% of midterm election years from 1994 to 2022. The 2026 seasonal backdrop is adding confluence.
Slight tangent, but it matters: the equal-weighted healthcare sector recently hit an all-time high. That’s not just UNH — it’s broad-based managed care, pharma, and biotech all moving together. Eli Lilly led a single-week move higher with an 11.6% gain on renewed obesity-drug pipeline confidence; AbbVie and J&J both broke out simultaneously. When three different healthcare subsectors move together like that, it tends to signal institutional allocation rather than stock-specific momentum.
Sector Breakdown: What’s Leading, What’s Lagging
The sector picture for the week ending July 17, 2026, is unusually clear. Technology (XLK) fell 1.8%. Communication Services (XLC) dropped 2.9%. Within those moves, semiconductor names bore the brunt: Micron Technology and AMD each tumbled more than 5%, SanDisk slipped over 12%, and Broadcom shed approximately 5%. The industry gauge for semiconductors has now fallen 20% from its record high — the worst drawdown since the April 2025 tariff shock. A Chinese AI startup, Moonshot, introduced Kimi K3 — described as among the largest AI models publicly available — stoking fresh concerns about AI hardware spending efficiency just as the market was already questioning capex levels.
On the other side of the ledger: Healthcare (XLV) surged 2.22%. Energy (XLE) gained 0.92% on the back of geopolitical risk in the Strait of Hormuz. Consumer Staples (XLP) rose 2.9%. REITs (XLRE) also outperformed. This is the classic defensive rotation playbook — capital moving out of high-multiple, high-growth exposures and into sectors with predictable cash flows, lower beta, and earnings visibility.
XLV carries a beta of approximately 0.58 — less than half the market’s sensitivity to swings in broader risk appetite. At a time when the VIX is creeping higher and semiconductor stocks are pricing in a reset, that low beta matters. The largest healthcare ETF surged 12.41% in the 90 days ending July 7 — a move that preceded Thursday’s UNH catalyst but also validates the institutional positioning that was already underway.
Broadcom’s Embedded Contradiction
There’s one name in the semiconductor space worth watching carefully as a counterweight to the rotation narrative: Broadcom (AVGO).
AVGO is down approximately 24% from its 52-week high of $495, and it’s reporting some of the fastest revenue growth of any mega-cap company in the market. Q2 AI semiconductor revenue came in at $10.8 billion — up 143% year-over-year. Management guided AI chip revenue to exceed $16 billion in Q3, representing more than 200% growth year-over-year, within total revenue guidance of approximately $29.4 billion, up 84%. The company also co-developed and unveiled the Jalapeño inference chip with OpenAI in late June — developed in just nine months, it’s the first in a multi-generation compute platform designed for initial deployment by the end of 2026, with expansion planned over subsequent years.
Broadcom reiterated its target of exceeding $100 billion in AI semiconductor revenues in fiscal 2027. The Apple $30+ billion chip deal, running through 2031, is already locked in. CEO Hock Tan’s thesis that hyperscaler custom silicon demand is both durable and growing has been confirmed by every major customer publicly. The company’s AI growth is concentrated around approximately six large customers — which creates customer concentration risk but also unusually high revenue predictability.
The bear case is valuation and margin dynamics. Gross margin is guided to decline to 74% in Q3 from 77.1% in Q2 as AI semiconductor mix rises. Infrastructure software grew only 9% year-over-year while semiconductors grew 79% — the business is becoming AI-dependent in a way that raises questions about diversification. Analysts’ average price target on AVGO sits near $510–$516, implying roughly 35–39% upside from current levels, but the stock trades at a premium 11.4x forward price/sales versus the broader sector at 6.88x.
The current setup is a compression trade: fundamentals accelerating, valuation contracting, sentiment rotating away. That combination historically resolves in one direction or the other — either the multiple re-expands as earnings season validates the AI revenue curve, or the pressure continues until the market finds a new equilibrium at a lower multiple. September 3 is Broadcom’s next earnings date.
Technical and Trading Framework
For UNH specifically, the post-earnings structure is worth tracking carefully. After the initial 6–7% gap higher on Thursday, the stock needs to hold the $429–$432 zone to confirm that the move has institutional backing and isn’t just a gap-and-fade. The prior area of congestion near $432–$440 represents the first meaningful resistance cluster before the 52-week high of $461. The 50-period exponential moving average near $421 becomes near-term support. RSI had been pulling back toward 39 before the earnings report — not oversold, just reset enough to give the stock room to run.
The MCR improvement — from 89.4% to 86.7% — is the most important fundamental variable to track in subsequent quarters. A further improvement toward 85% would effectively confirm UNH’s repricing to a $500+ range. A reversal back above 88% would reopen the cost-spiral thesis that plagued the stock in 2025.
For the sector ETF (XLV), the 10-day moving average crossed bullishly above the 50-day moving average in late May — a pattern that has historically continued higher in the following month in the majority of prior instances. The current setup shows the XLV maintaining relative strength versus the S&P 500 (SPY) after breaking a multi-year relative downtrend. The XLV/SPY ratio had fallen to a quarter-century low before its explosive single-week reversal. Mean-reversion alone from those extreme levels argues for further XLV outperformance if tech remains under pressure.
For AVGO, $360–$370 represents a zone worth watching — below that level and the valuation argument becomes harder to construct without a significant forward earnings reset. The current RSI near 51 is neutral. Williams %R is in buy territory. The MACD is showing a neutral signal. The stock is technically coiling between near-term resistance near $395–$400 and support near $370.
Scenario Modeling
Bull Case — Healthcare Rotation Deepens, Tech Stabilizes: UNH sustains MCR improvement below 87% through Q3, confirming the managed care turnaround as structural rather than cyclical. Full-year EPS prints near the high end of the $19.50–$20.00 guidance range. XLV maintains its relative outperformance as semiconductor stocks stabilize above key support and earnings season reduces AI capex uncertainty. Price targets near $480–$512 come into play for UNH by year-end. AVGO’s September earnings validate the $16 billion AI chip revenue guidance, re-rating the stock toward the $480–$500 range. Catalyst: Managed care peers like Humana and Elevance confirm similar MCR improvement trends, driving sector-wide re-rating.
Base Case — Selective Rotation, Mixed Tape: The rotation from semiconductors into defensives continues through August but moderates as earnings season provides mixed signals. UNH holds gains near $440–$460. AVGO grinds toward $400–$420 as valuation pressure eases modestly. The S&P 500 oscillates in a 7,400–7,700 range, with breadth improving but index-level gains capped by continued Nasdaq weakness. Healthcare and Consumer Staples maintain relative outperformance but not at the same pace as the initial rotation impulse. The equal-weighted S&P 500 continues to make new highs even as the cap-weighted index trades sideways.
Bear Case — Macro Deterioration Hits Both Sectors: U.S.-Iran tensions escalate beyond existing pricing, pushing crude oil materially higher and reigniting CPI concerns. The Fed signals a rate hike rather than a cut at the July meeting. Healthcare stocks, despite their defensive characteristics, see profit-taking after the sharp recent move — the XLV/SPY ratio, having printed a +4.63 standard deviation reading, encounters a statistical mean-reversion. UNH gives back 10–15% of its post-earnings gains if the MCR improvement is partly attributed to the $860 million prior-period reserve release and Q3 guidance disappoints. Key failure level for UNH: a close below $413. For XLV: a breakdown below the 50-day moving average near $151–$153 would signal rotation exhaustion.
Active Trader Strategy Framework
The setup being handed to active traders this week is fundamentally about identifying which side of the rotation has duration. A few considerations worth running through before positioning:
On the healthcare side, the catalyst is confirmed — UNH’s earnings are in the tape, and analyst upgrades have already moved. The next question is whether peer confirmation follows. Elevance Health (ELV), Humana (HUM), and Centene (CNC) reporting in the coming weeks will either validate or undermine the sector-wide MCR improvement thesis. A single company beating estimates is noise; three companies confirming the same trend is signal. The managed care earnings calendar becomes the next key data point for the XLV thesis.
On the semiconductor side, the size of the drawdown — 20% from the June record in the sector gauge — warrants tactical attention. Historically, 20% sector corrections in high-momentum industries tend to attract institutional accumulation even when near-term sentiment is negative. The question is whether the drawdown reflects a valuation correction (likely, largely priced in) or a fundamental demand inflection (not yet confirmed). Broadcom’s September 3 earnings will be the most important data point for the AI capex cycle since TSMC’s Q2 report. Watch forward AI revenue guidance carefully.
Risk management: At current volatility levels, with the VIX near 16.73 and semiconductor stocks seeing daily moves of 5–12%, options premiums in the sector are elevated. Defined-risk structures tend to outperform directional bets in environments where magnitude is uncertain. Position sizing matters more in rotation trades than in trend-following trades — the whipsaws can be significant if the rotation reverses before completing.
The macro overlay — Iran tensions, June CPI at 3.5%, Fed meeting in late July — creates a backdrop where geopolitical risk and inflation data move together in ways that don’t always follow historical correlations. Elevated oil prices are simultaneously inflationary (bearish for bonds, pressuring rate-sensitive sectors) and a rotation catalyst into energy (which has already outperformed this week). Traders managing multi-sector exposure need to model these interactions rather than treating each sector in isolation.
What to Watch Next
The managed care earnings season is just getting started. The semiconductor calendar still has major reports ahead — AMD on August 4, Intel scheduled for late July, and Broadcom in September. Whether the two halves of this trade — healthcare strength and chip weakness — can coexist for another 4–6 weeks depends heavily on how those earnings prints land.
One thing is clear from Friday’s tape: the market is not choosing between AI and no-AI. It’s choosing between AI stories that can justify their valuations and those that can’t — at least for now. UnitedHealth, with its 73% recovery from a cyclical low and a MCR improvement that finally reflects two years of pricing discipline, sits firmly in the first category.
The question nobody can answer cleanly yet is whether the healthcare rotation is a multi-quarter structural shift or a tactical two-month defensive bid that reverses when the chip sector finds its footing. History suggests these rotations tend to run further and faster than initial positioning expects — but the +4.63 standard deviation reading in XLV/SPY makes duration uncertainty real.
Preparation and risk management, not prediction. That’s where the work happens.
For informational and educational purposes only. Not investment advice. Trading involves risk, including loss of principal.