August 2, 2026
META Breaks Down. MSFT Breaks Out.
Featured: META Breaks Down. MSFT Breaks Out.
Dear Reader,
They declared a ceasefire!
Until they didn’t.
Then Trump said we were about to sign a deal.
Until we started shooting at each other again.
According to one source, Trump has said an Iran deal is “close” 38 times since the war began.
In the time between writing this message and you reading it, who knows whether we’ll be hearing about an imminent deal… or more bombing.
And it doesn’t matter.
This is all a distraction.
Here’s the REAL reason why Trump may NEVER end this war.
To your future,

Addison Wiggin
Founder, Grey Swan Investment Fraternity
META Breaks Down. MSFT Breaks Out.
Key Takeaways
- Microsoft surged 15.5% on July 31, the largest single-day market cap gain in U.S. stock market history, after reporting fiscal Q4 revenue of $90.01 billion, up 18% year over year, with Azure crossing $100 billion in annual revenue for the first time.
- Meta fell more than 9% after hours on July 29 despite reporting Q2 revenue of $60.8 billion, up 28% year over year. Diluted EPS of $6.18 missed the consensus of approximately $7.22 by 14.4%, snapping a six-quarter streak of beats.
- Free cash flow collapsed to $784 million from $8.55 billion a year earlier, as Meta’s quarterly capital expenditures reached $31.08 billion and a $2.4 billion legal charge hit the income statement without prior guidance warning.
- Microsoft’s commercial remaining performance obligations jumped 84% to $678 billion, representing signed enterprise contracts that document AI monetization in a way Meta’s internal infrastructure spending cannot yet match.
- Meta’s 52-week low of $520.26 is the critical level to watch over the next one to five sessions. The after-hours low of approximately $529 tested that zone. Whether buyers defend it on a closing basis is the single most important near-term signal.
- The August 7 jobs report is the next macro catalyst for both names. Rate expectations remain the primary external variable capable of shifting valuations across large-cap tech regardless of company-specific fundamentals.
- This is a stock-specific trading environment. Index breadth is narrowing, with roughly 64% of S&P 500 stocks above their 50-day moving averages and the McClellan Oscillator running below zero. Sector rotation is not the story. AI monetization execution is.
THE STARLINK OF ENERGY
This little-known stock could benefit from a major government catalyst this August
A single “Energy Cube” can be delivered by truck… dropped next to a data center, military base, or industrial site… and provide reliable electricity for decades.
Think of it as the “Starlink of Energy.” A government milestone expected this August could shine a spotlight on one little-known company at the center of the Energy Cube story.
Market Snapshot
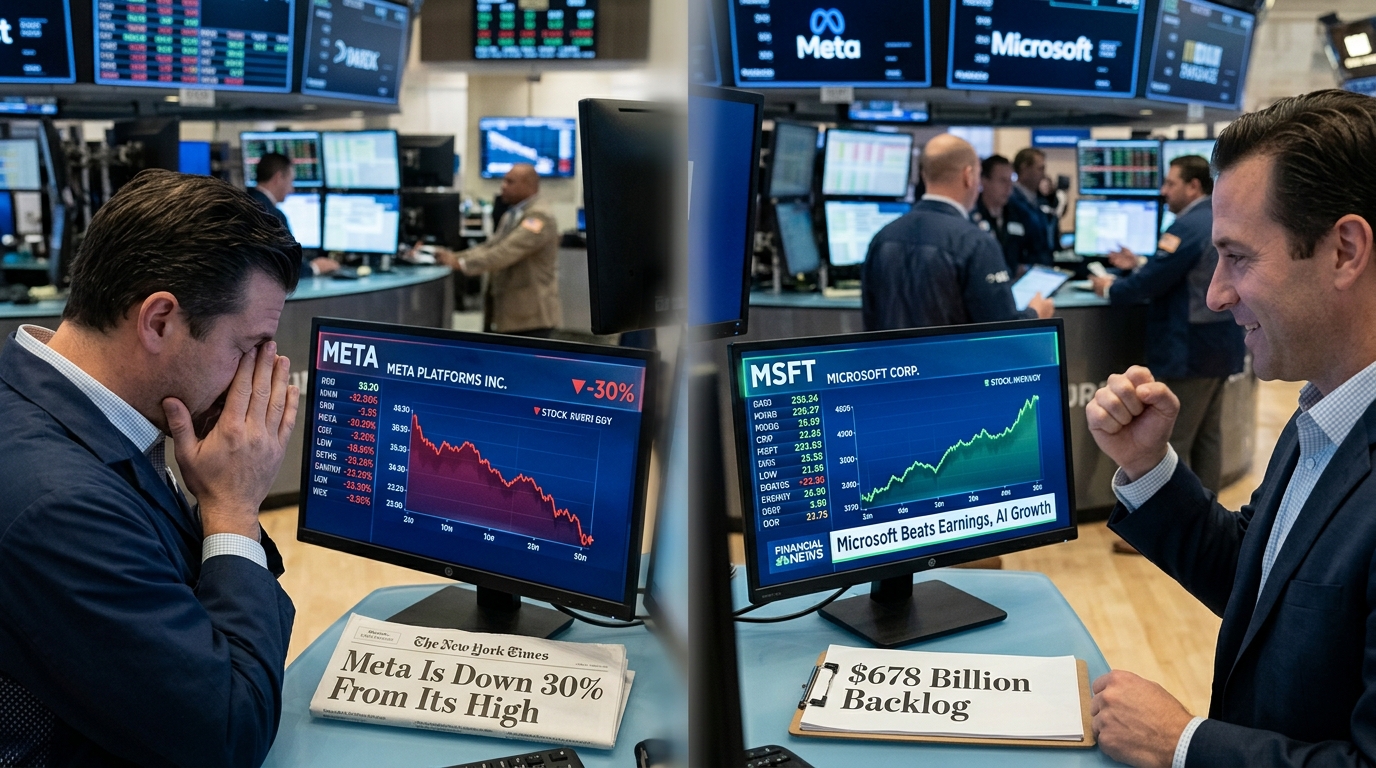
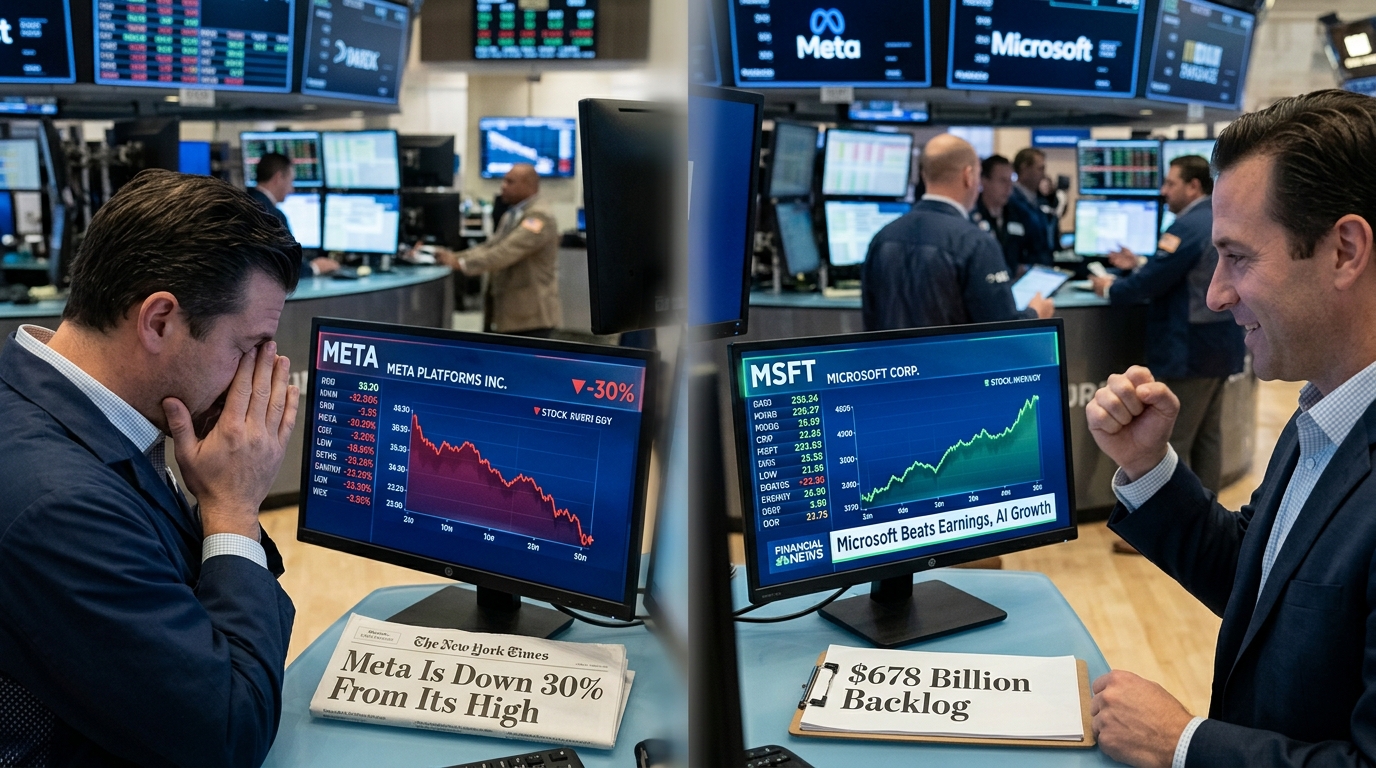
The week ending July 31, 2026 was one of the most decisive stretches of the year for active traders in large-cap technology. Five of the largest companies on earth reported earnings within days of each other, and the market did not respond uniformly. Microsoft surged 15.5% on July 31 following its fiscal Q4 report, delivering the largest single-day market cap gain in U.S. stock market history. Meta sank more than 9% after hours on July 29 before stabilizing into the week’s close. Amazon contributed further upside to the Nasdaq, which rose approximately 1% on July 31 following its own strong cloud results.
Breadth heading into this week is mixed. Around 64% of S&P 500 stocks are trading above their 50-day moving averages as of the July 31 close, off the recent high of roughly 70% touched earlier in the week. The McClellan Oscillator has been running below zero, a sign that the pace of advancing stocks is slowing even as the index holds up. That’s a classic signal worth watching: index-level strength held aloft by a shrinking group of leaders, while the broader market quietly consolidates.
Goldman Sachs raised its S&P 500 earnings per share forecast to $340 for 2026, representing roughly 24% annual growth, with AI infrastructure beneficiaries expected to account for approximately half of that earnings growth. The valuation multiple is expected to remain around 21 times earnings as modest yield declines are offset by geopolitical uncertainty and investor skepticism about the durability of AI-related profits. The Federal Reserve remains on hold, and the next meaningful macro catalyst is the July jobs report, which lands Friday, August 7.
For active traders focused on the next one to five sessions, this is a stock-specific environment. The macro backdrop is not the story. The AI monetization scorecard is.
Why Meta Is in Focus
Meta Platforms closed at $585.61 on July 29 before falling to approximately $529 in after-hours trading following its Q2 2026 earnings release. That single-session move compressed a stock that had already been grinding lower from its all-time closing high of $787.42, set on August 12, 2025. Heading into August 2026, Meta sits roughly 30% below that peak. The 52-week low is $520.26. That matters. The stock is now testing a range that has attracted buyers in prior sessions, and the catalyst that drove the most recent leg lower is now fully known.
What makes Meta worth watching over the next several sessions is not that the results were good. They were not, on an EPS basis. What matters is the gap between what actually happened and what it signals about the next three to six months. When the full picture is understood, the stock’s positioning becomes interesting from a risk-reward standpoint, even if the direction is not obvious.
This is not the first time Meta reported a revenue beat and still got punished. In Q1 2026, the company posted a 56.79% EPS beat and the stock still fell more than 8% on the day. Revenue beats are no longer sufficient. The market is focused on cash flow and capex trajectory, not top-line growth. That shift in what the market is measuring is exactly why Meta is in focus right now.
The Earnings: What the Numbers Actually Said
Meta reported Q2 2026 revenue of $60.8 billion, up 28% year over year, and slightly ahead of the $60.29 billion analyst consensus. The ad engine performed. Advertising revenue reached $59.36 billion, up 27% year over year. Ad impressions rose 14%, and average price per ad grew 12%. Daily active people across the Family of Apps averaged 3.60 billion in June 2026, up 3% year over year. The core business accelerated.
2026: The Year of the Robot
A revolutionary new robot is beginning to emerge.
Elon Musk says it will “change civilization as we know it.”
Microsoft’s Bill Gates said, “it will be as revolutionary as the PC.”
Nvidia’s Jensen Huang says it could be “the largest technology industry the world has ever seen.”
Creating a $24 trillion opportunity for investors.
And one $7 stock could be the biggest winner of all.
Everything below revenue fell apart.
Diluted EPS came in at $6.18, missing the consensus estimate of approximately $7.22 by 14.4%, snapping a six-consecutive-quarter streak of beating expectations. Total costs and expenses surged 55% to $42.03 billion. Operating margin collapsed to 31% from 43% a year earlier. Two charges drove most of the damage: a $2.4 billion legal charge, sitting inside a G&A line that more than doubled year over year to $5.6 billion, and $1.18 billion in severance connected to the May 2026 round of layoffs that reduced headcount by roughly 8,000 employees. Free cash flow shrank to $784 million, down from $8.55 billion in the year-ago quarter, as capital expenditures reached $31.08 billion for the quarter alone.
Full-year 2026 capex guidance was narrowed to $130 billion to $145 billion, raising the lower end from the prior $125 billion floor. Full-year expense guidance was raised to $165 billion to $169 billion, with management attributing the increase to the incorporation of the $2.4 billion legal charge. Reality Labs posted a quarterly operating loss of $4.62 billion on $431 million in revenue. The CFO guided full-year Reality Labs losses to land roughly in line with 2025’s approximately $19 billion.
Q3 2026 revenue guidance came in at $61 billion to $64 billion, with the $62.5 billion midpoint sitting below the $63.2 billion analyst consensus at the time of the release. The guidance assumed approximately 1% foreign exchange headwind. Management also noted that the $2.4 billion legal charge was not anticipated in prior guidance, which confirms the charge was a genuine surprise rather than a disclosed item being formally recognized.
What Microsoft Proved, and Why It Matters for META Traders
Understanding Meta’s reaction requires understanding Microsoft’s. On the same earnings night, Microsoft reported revenue of $90.01 billion, up approximately 18% year over year, beating the $87.62 billion consensus. EPS came in at $4.74 adjusted, ahead of the $4.24 estimate. Azure grew 43% year over year at constant currency, beating Street estimates of roughly 40%, and crossed $100 billion in full-year revenue for the first time. Microsoft 365 Copilot surpassed 30 million paid seats. Commercial remaining performance obligations jumped 84% to $678 billion, a figure representing signed enterprise contracts for future AI infrastructure spend.
The stock surged 15.5% on July 31, the largest single-day market cap gain in U.S. history. MSFT closed at $464.72, up from the $349.20 52-week low. The 52-week high is $553.72. After the surge, the stock is now trading above its 200-day moving average, which has been a resistance zone for much of 2026 given that the stock had given up 19% year to date heading into earnings week. Analyst consensus price targets center around $564, with 25 analysts averaging that level in the past six months.
The structural difference the market is expressing is straightforward. Microsoft can point to a growing cloud business that rents AI capacity to external customers, documents the conversion in contracted backlog, and shows accelerating revenue alongside its capex. Meta spends at comparable scale but invests in its own infrastructure to improve its own apps. The cost is visible. The new revenue line is not. Investors are applying a clear discount to spending that lacks an external monetization mechanism, and the July 29 earnings reaction formalized that discount into price.
Technical Picture: Meta
Meta peaked at $787.42 on August 12, 2025. The stock’s 52-week low sits at $520.26. After-hours trading on July 29 pushed the stock toward $529, which means the post-earnings low tested the 52-week low zone almost exactly. That is not coincidental. That level has served as a meaningful floor in prior corrections, and the proximity of the after-hours reaction to that support is the first thing active traders should note.
Technical resistance sits in the $583 to $617 zone based on multiple trend lines and moving average confluences. The $650 level has acted as a ceiling in prior recovery attempts. The $687 area represents the next meaningful overhead resistance. On the downside, the $520 to $521 zone is the line that matters most. If the stock cannot hold that level on a closing basis, the technical picture deteriorates materially.
Volume on the post-earnings session will be a critical signal. Heavy selling volume that stabilizes near the $520 to $530 zone over the first two to three sessions of August would suggest institutional players are defending that level. Sustained above-average volume on any recovery attempt through $583 would be the first confirmation signal that the selloff is exhausting itself. Without volume confirmation on a bounce, moves back toward $560 to $580 remain suspect.
RSI on the daily chart was tracking in neutral territory heading into earnings. The post-earnings gap lower is likely to push short-term momentum indicators into oversold territory, which historically creates the conditions for mean-reversion moves. That does not make the stock a buy. It means the conditions for a tactical bounce are forming, and traders need a confirmation signal before acting on that thesis.
Technical Picture: Microsoft
Microsoft’s July 31 close at $464.72 represents a significant shift in the stock’s technical structure. The 52-week range is $349.20 to $553.72. The 15.5% single-session move puts MSFT back above several key moving average levels that had acted as resistance throughout most of 2026. Key support on any pullback from current levels is the $430 to $450 zone, which aligns with prior consolidation ranges and accumulation volume. Below that, the $396 to $413 range represents the next meaningful support cluster.
The overhead picture is less clear. The 52-week high of $553.72 remains roughly 19% above current levels. Fibonacci retracement analysis of the full decline from the all-time closing high of $538.66 in October 2025 to the 52-week low of $349.20 suggests resistance near the 61.8% retracement level in the $466 to $477 range. The stock closed just inside that zone on July 31. A clean break and hold above $477 on elevated volume over the next several sessions would be the next meaningful technical confirmation.
After “33X” call, Hall of Fame Trader Jon Najarian reveals NEW Tesla prediction…
Jon Najarian put his neck out on national TV for Tesla in 2014… Before Tesla stock flew to peak gains of 3,392% today! But this “33X” call on Tesla might pale in comparison to Jon’s newest prediction about Elon Musk… That a potential $44 TRILLION plan could be coming next.
The analyst median price target of $564 implies roughly 21% upside from current levels. The CFO explicitly guided for growth to further accelerate in the first half of fiscal 2027, which gives institutional buyers a forward-looking reason to accumulate. Watch for whether the July 31 surge holds or fades. A pullback that finds buyers in the $430 to $450 zone on lower volume would reinforce the bull case. A rollover below $430 would suggest the post-earnings move was more technical squeeze than genuine accumulation.
Catalyst Review
For Microsoft, the primary catalyst is now embedded in price. The $678 billion commercial backlog, Azure at $100 billion annually and growing at 43%, and Copilot at 30 million seats are all documented. The next meaningful catalyst is the October earnings cycle. Between now and then, watch for enterprise adoption data, any Copilot seat expansion announcements, and Azure’s trajectory commentary at industry conferences. The CFO’s statement that growth will further accelerate in fiscal 2027’s first half is a forward catalyst that could sustain institutional interest through the back half of 2026.
For Meta, the near-term catalyst structure is more complicated. The Q3 guidance midpoint of $62.5 billion implies roughly 20% year-over-year revenue growth. That is strong. The question is whether the market prices EPS recovery as the $2.4 billion legal charge and $1.18 billion in severance costs roll off the income statement. The severance hit should be largely cleared by Q3, with most affected employees expected off the books by quarter-end. The legal exposure is less predictable. Meta is facing multi-front youth-related litigation including the federal multidistrict case MDL 3047 and more than 2,325 personal injury claims, plus state attorney general actions. These do not clear on a schedule.
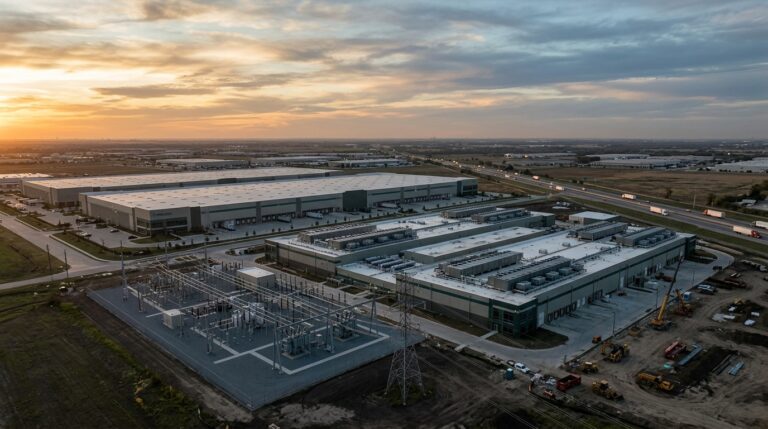
Also worth monitoring: Meta announced a strategic partnership with BlackRock, investing over $10 billion to develop a data center campus in El Paso, Texas. That is a structural commitment to AI infrastructure that is not going to reverse. Zuckerberg’s framing on the earnings call was explicit, stating that margins will be meaningfully higher on selling intelligence than on selling raw compute. That is the strategic thesis. The market is not rewarding it yet. The question for active traders is whether the next one to five sessions offer an entry point before the thesis gets more traction.
Scenario Modeling
META – Bull Case: The $520 to $521 zone holds as support on a closing basis. Volume stabilizes over the first two to three sessions of August. The broader market maintains its footing as tech digests earnings week. Morgan Stanley’s $775 price target and the Wall Street consensus that skews heavily toward buy ratings (with zero sell ratings according to recent data) provides a fundamental floor. If Meta can close above $583 on increasing volume, a recovery toward the $617 to $650 range becomes the near-term path. That recovery would require the market to start pricing EPS normalization in Q3 as one-time charges fade.
META – Base Case: The stock finds a trading range between $520 and $583 over the next five sessions. Buyers defend the 52-week low zone but cannot mount a sustained recovery while the legal overhang remains uncertain and capex guidance continues to weigh on free cash flow expectations. The stock becomes range-bound ahead of any Q3 clarity. This is likely the highest-probability near-term outcome given that both the EPS miss and the soft Q3 guidance midpoint give sellers justification to stay in control.
META – Bear Case: A sustained close below $520 invalidates the 52-week low support level and opens a path toward the $490 to $500 zone. Additional legal charges in Q3, a capex guidance increase beyond $145 billion, or further weakness in the broader tech sector could accelerate that move. Reality Labs losses exceeding the CFO’s guidance of roughly in-line with 2025’s $19 billion would be a further negative signal. This scenario requires multiple catalysts working simultaneously, but traders should define their risk before the fact, not after.
MSFT – Bull Case: The July 31 close at $464.72 holds as a base. A modest consolidation in the $445 to $465 range over the next few sessions, followed by a break above $477 on volume, would set up a move toward the $500 to $532 zone. Continued enterprise adoption data and any positive commentary from tech conferences would sustain the momentum. The median analyst target of $564 gives institutions a meaningful runway above current levels.
MSFT – Base Case: The post-earnings surge attracts some profit-taking as momentum traders who were long into the release take gains. The stock pulls back toward the $430 to $450 zone and finds support from longer-term buyers who missed the initial move. This consolidation holds the 52-week low breakout structure intact and sets up the next leg higher into the October earnings cycle. This is the most plausible path given the magnitude of the single-session move.
MSFT – Bear Case: The surge fails to hold above $460, and the stock rolls back toward $413 to $430 as broader market conditions deteriorate. A weaker-than-expected jobs report on August 7, rising rate expectations, or a broad risk-off move in equities could pull the stock back toward pre-earnings levels. A break below $396 would signal the post-earnings move was a technical squeeze without sustainable institutional follow-through.
Risk Assessment
For Meta, the primary risk is not the capex itself. It is the legal overhang. A $2.4 billion charge that management did not anticipate in prior guidance, connected to ongoing youth-related litigation with more than 2,325 personal injury claims and multi-state regulatory actions, is not a one-quarter event. It is a recurring variable. Markets will not fully close that discount until the legal trajectory is clearer, and that clarity may not arrive in Q3. Traders should treat any bounce in Meta as a tactical opportunity within a still-uncertain longer-term picture, not as a fundamental resolution.
For Microsoft, the risk is valuation and adoption pace. The stock ran 15.5% in a single session. Even accounting for the earnings quality, that move compresses the near-term reward-to-risk profile. Copilot’s 30 million paid seats sounds impressive, but it represents a small fraction of the installed base of Microsoft 365 users. Converting the broader knowledge worker base to an incremental paid AI seat may be slower than the backlog growth implies. And the accounting change that shifts future data center leases from finance leases to operating leases means some of the capex discipline investors are rewarding may be partly definitional rather than purely operational.
The macro risk for both names is the August 7 jobs report. Markets are watching for any sign that the labor market is weakening in a way that shifts Fed expectations. Rising rate expectations following any stronger-than-anticipated data could pressure valuations in both stocks, particularly given their large cap weights and sensitivity to discount rate assumptions.
Active Trader Strategy Framework
The environment heading into the week of August 3 favors stock-specific positioning over broad sector exposure. Earnings week is over for most of the major names. What follows is a period of digestion, where markets assess which reactions were durable and which were emotional. That is the window where active traders can find asymmetric opportunities.
For Meta specifically, the tactical framework centers on one level: $520. That is the 52-week low. It is the line the post-earnings after-hours reaction almost touched. A stock that holds its 52-week low after a significant earnings miss, when the bad news is now fully disclosed, often provides a better risk-reward entry point than one that keeps grinding lower on unclear catalysts. The known bad news is now priced in. The unknown is whether more legal charges arrive or whether Q3 execution surprises to the upside.
- META key support: $520 to $521 (52-week low zone). A sustained close below this level on volume would be the signal to step aside.
- META first resistance: $583. A close above this level with above-average volume is the first confirmation of an emerging recovery.
- META secondary resistance: $617 to $650. This zone requires broader sentiment improvement and at least one session of meaningful volume-backed buying.
- MSFT key support: $445 to $465 post-earnings base. Watch whether the July 31 surge consolidates cleanly or rolls immediately.
- MSFT resistance: $477 in the near term, $532 as the next Fibonacci zone of interest, $553 as the 52-week high.
- Volatility watch: Implied volatility in both names typically compresses after earnings. Traders who use options should note that premium decay accelerates in the days immediately following a major earnings move.
- Macro catalyst: August 7 jobs report. A weaker reading that reduces rate hike expectations could provide a tailwind for both names. A stronger reading could compress valuations further.
Trader’s Checklist
Before acting on either idea, work through these questions:
- Is Meta holding above $520 on a closing basis in the first two sessions of August? A close below that level on elevated volume changes the risk framework entirely.
- Is Microsoft consolidating above $445, or is the post-earnings surge fading on heavy selling volume that suggests the move was a squeeze rather than genuine accumulation?
- Is the broader tech sector stable, or is the post-earnings digestion period producing broader distribution? Check the Nasdaq Composite’s advance-decline line and the percentage of tech stocks holding above their 50-day moving averages.
- Are there any new legal disclosures from Meta between now and the August 7 jobs report? Management flagged ongoing youth-related legal and regulatory matters. Any new filing or court development could re-accelerate the downside.
- Is Microsoft receiving any positive commentary from enterprise software conferences or analyst days that reinforces the Copilot adoption story?
- Where is the August 7 jobs number landing, and what does it imply for the Fed’s next move? Rate expectations are currently the single largest macro variable for both stocks on a forward-looking basis.
The Strategic Read
Markets just gave active traders two clear data points in a single evening. Microsoft has answered the AI monetization question with a $678 billion contracted backlog, 43% Azure growth, and accelerating guidance. Meta has not answered it yet. Until it does, the discount on Meta reflects genuine uncertainty, not pure pessimism. Both things can be true at once.
What matters heading into August is not which company is objectively better. It is which stock’s risk-reward is most clearly defined over the next one to five sessions. Meta offers a higher-risk, potentially higher-reward situation at the 52-week low with bad news now disclosed. Microsoft offers a lower-risk continuation play if the post-earnings base holds, with a longer runway to analyst price targets.
The part people tend to skip in weeks like this is the planning. Knowing the levels before price reaches them is what separates a disciplined trade from a reactive one. Define the levels. Define the conditions that confirm or invalidate. Let price come to your framework rather than chasing it.
The next meaningful move in both names is still forming. That is actually the best time to prepare.
For informational and educational purposes only. Not investment advice. Trading involves risk, including loss of principal.