September 21, 2026
Bonus Content: Oil Fell After Missiles Hit Riyadh. What Must Break to Reverse.
Gold and copper prices are rising fast. That’s a fact that’s impossible to ignore.
What many people are missing is that the opportunity to gain early exposure to companies exploring for these metals in Tier-1 jurisdictions may not last forever.
That’s where one little-known Canadian explorer comes into play. It has a small market cap and low share price alongside a strong treasury and major-company-funded drilling underway now in two premier Australian mineral belts.
Successful drilling could bring greater market attention to the copper-gold potential the company is targeting across its portfolio.
Access our brand-new FREE report to get the full story.
Inside, you’ll learn the company’s name and ticker symbol, explore its Australian project portfolio, and get the latest on drilling now underway.
Access the report by clicking here and learn just why this overlooked copper-gold explorer is well-positioned for significant upside.
Oil Fell After Missiles Hit Riyadh. What Must Break to Reverse.
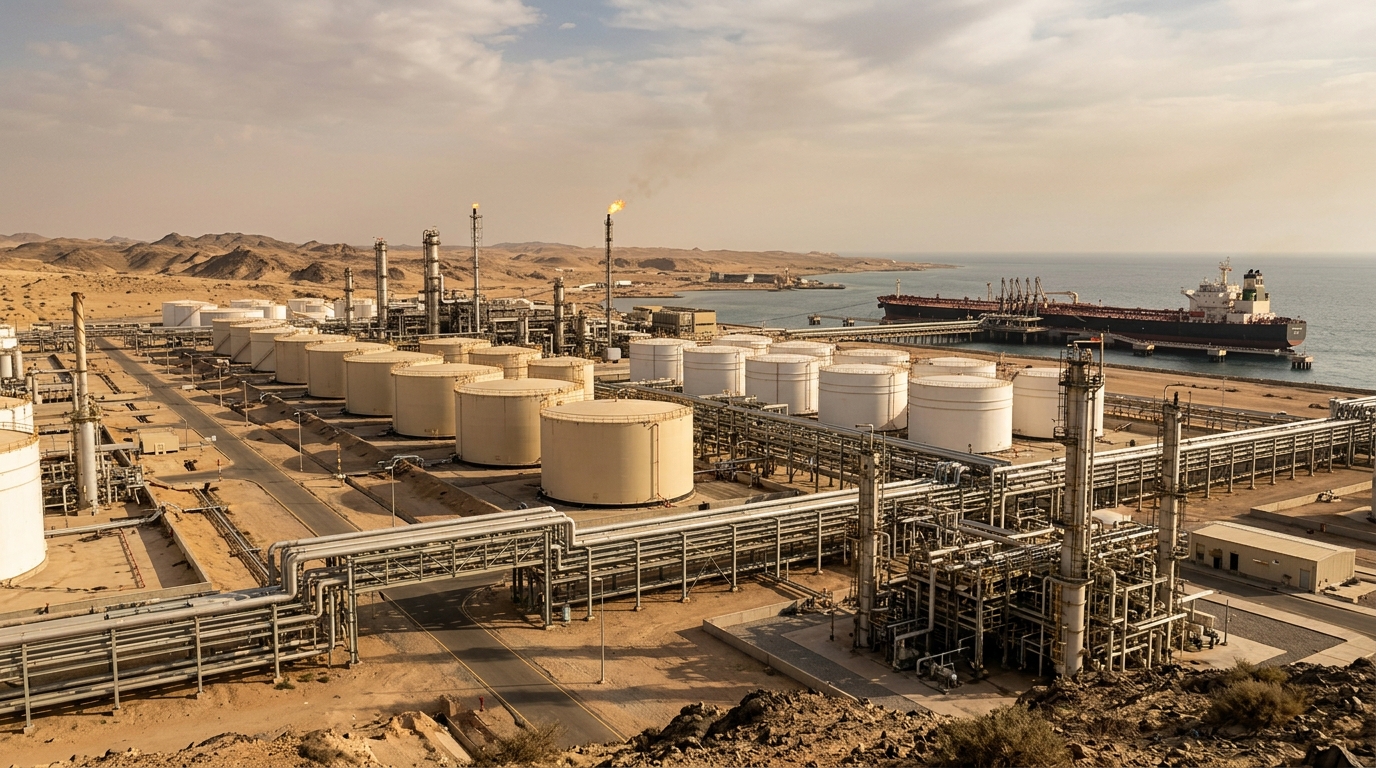
Saturday’s Houthi strikes on Riyadh and Yanbu were, on paper, the most alarming attack of this conflict. On September 19, Houthi forces struck Saudi Arabia’s capital for the first time since the latest escalation, firing a ballistic missile that Saudi air defenses said they intercepted, and separately targeted facilities around Yanbu on the Red Sea. Smoke rose near King Khalid International Airport. The market opened higher. Then it sold off hard, extending a losing run that began before the missiles flew.
Brent fell to $101.71 a barrel by Monday morning, down $2.16 or 2.08%, its lowest since September 10. WTI fell to $98.15, off $2.15 or 2.14%. Monday marked the fourth consecutive trading day of declines, the longest losing streak since June. The opening pop was sold within hours. The question every energy desk is asking: if a strike on a capital city cannot hold a bid, what exactly is this market trading?
The Flow Numbers That Ended the Rally
The answer sits in the logistics data, not the headlines. JPMorgan analysts in a September 18 note described Middle East oil flows as remaining “surprisingly strong” despite disruption to Saudi Arabia’s East-West pipeline, with total flows averaging 17.1 million barrels per day over the past ten days, 6.1 million bpd below the 2025 average. That 6.1 million bpd gap is the number that matters: it represents the remaining war discount. While still significant, it is far smaller than markets had feared when the pipeline went down on September 10.
Kpler data showed Saudi exports recovering to just over 4 million bpd in September after slumping to 2.4 million bpd in August, the lowest since at least 2013. JPMorgan satellite data showed Saudi oil moving through Hormuz averaging 2.9 million bpd over the past six days, up from just 700,000 bpd in August. That rerouting pivot, from the disabled East-West pipeline back through Hormuz, is the structural story underneath Monday’s price action.
CENTCOM’s Admiral Brad Cooper confirmed in a video message Saturday that oil and LNG shipments through the Strait of Hormuz over the past two weeks reached the highest level in six months, signaling that U.S. naval protection and mine clearance efforts are paying off. Cooper noted that U.S. forces supported more than one billion barrels of crude leaving the Gulf, while assisting over 2,000 commercial ship transits through the strait. Hopes for U.S.-Iran diplomacy during UN General Assembly week added to the selling pressure.
Sector Positioning: Producers vs. Refiners
ExxonMobil and Chevron have each gained roughly 40% year-to-date, but U.S. refiner stocks have outperformed the majors, with Phillips 66, Valero Energy, and Marathon Petroleum shares more than doubling as product markets tighten globally. The upstream-vs-refiner split is now the core positioning decision in the energy complex. Refiners face tighter economics: Marathon Petroleum and Valero risk margin compression if crude costs climb faster than they can pass through, and a sustained crude spike above $105 would strain those names. Chevron posted Q2 2026 adjusted EPS of $6.06, while Exxon has strung together four consecutive EPS beats.
Technical Framework
Brent is sitting just above the $101.50 support zone, below both the Ichimoku cloud ($102.78-$104.29) and the short-term 20-period SMA resistance at $104.81. Any five-hour close below $101.50 would confirm a structural break, likely triggering a move toward the Fibonacci 38.2% level at $100.44 and possibly $97.49. The $100 psychological level is the line in the sand for directional conviction this week.
Scenario Modeling
Bull Case
Saudi Hormuz transit volumes fall back toward August’s 700,000 bpd average, either from a fresh Houthi strike on rerouted tankers or renewed Iranian interdiction. The rerouting depends on the Strait of Hormuz staying open, which puts both main chokepoints in the same story. A successful attack on a laden tanker in the strait could restore $10-$15 of war premium quickly, targeting the September high near $108-$110.
Base Case
Roughly half of normal flows are expected to return to the East-West pipeline within days, though full capacity restoration is not expected for another six weeks. Saudi exports hold near 4 million bpd via rerouted Hormuz tankers. Brent consolidates between $98 and $106, with diplomatic signals from UN General Assembly week capping the upside.
Bear Case
A credible U.S.-Iran diplomatic breakthrough during UNGA week combined with sustained Hormuz transit above the six-month high drains the residual war premium. Brent breaks $100, targeting the 50-day EMA near $88-$89. The bear thesis requires both the pipeline repair timeline to hold and no fresh escalation against rerouted tankers.
Active Trader Strategy Framework
The war premium in crude is now almost entirely a Hormuz-flow premium. Traders should track two numbers weekly: Saudi Hormuz transit (currently 2.9 million bpd, vs. 700,000 in August) and total Middle East flows (currently 17.1 million bpd, vs. a 23.2 million bpd 2025 average). A sustained drop back toward 1.5 million bpd on Saudi Hormuz transit would be the earliest quantitative signal to reassess direction.
Position sizing should reflect the current volatility regime. The $100 level is both technical support and political psychology: a close below it shifts the framing from correction to trend reversal. Above $105, the East-West pipeline timeline and Aramco’s October allocation decisions become the next catalysts.
The market has decided, at least for now, that barrels moving through the strait matter more than missiles over Riyadh. That decision holds until the flow data says otherwise. Discipline in tracking those numbers is the only edge in a market where the geopolitical inputs can change within a single session.