September 25, 2026
Bonus Content: Small Caps Are Trading Like Bonds. Mid-Caps Are Not.
Dear Reader,
Starting as soon as a few months from now, the United States government will make a sweeping change to bank accounts nationwide.
It will give them unprecedented powers to control your bank account.
They could closely track every transaction.
They could even freeze it.
Unless you protect yourself today. Fortunately, there are 4 simple steps you can take to safeguard your savings.
Discover these 4 simple steps here.
Good luck and God bless!

Martin Weiss
Dr. Martin D. Weiss, Founder
Small Caps Are Trading Like Bonds. Mid-Caps Are Not.
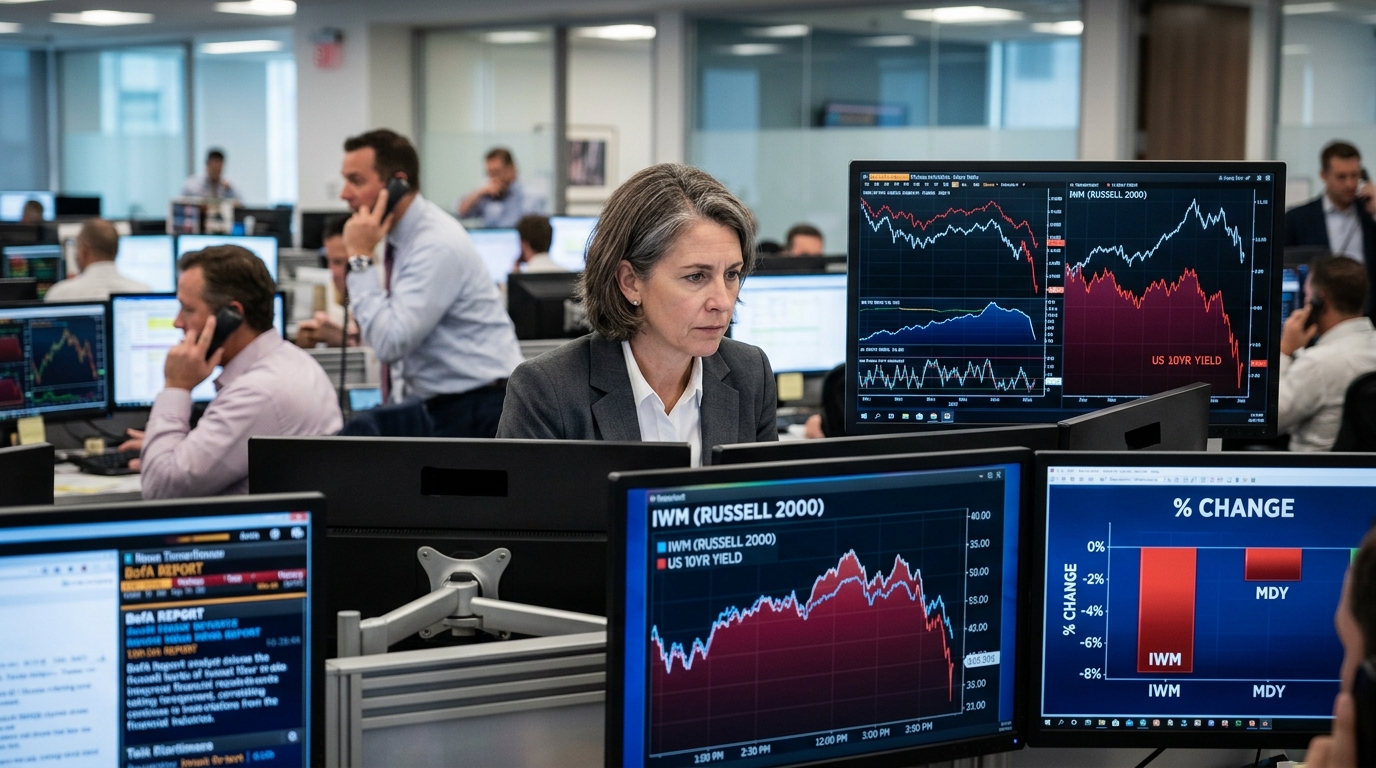
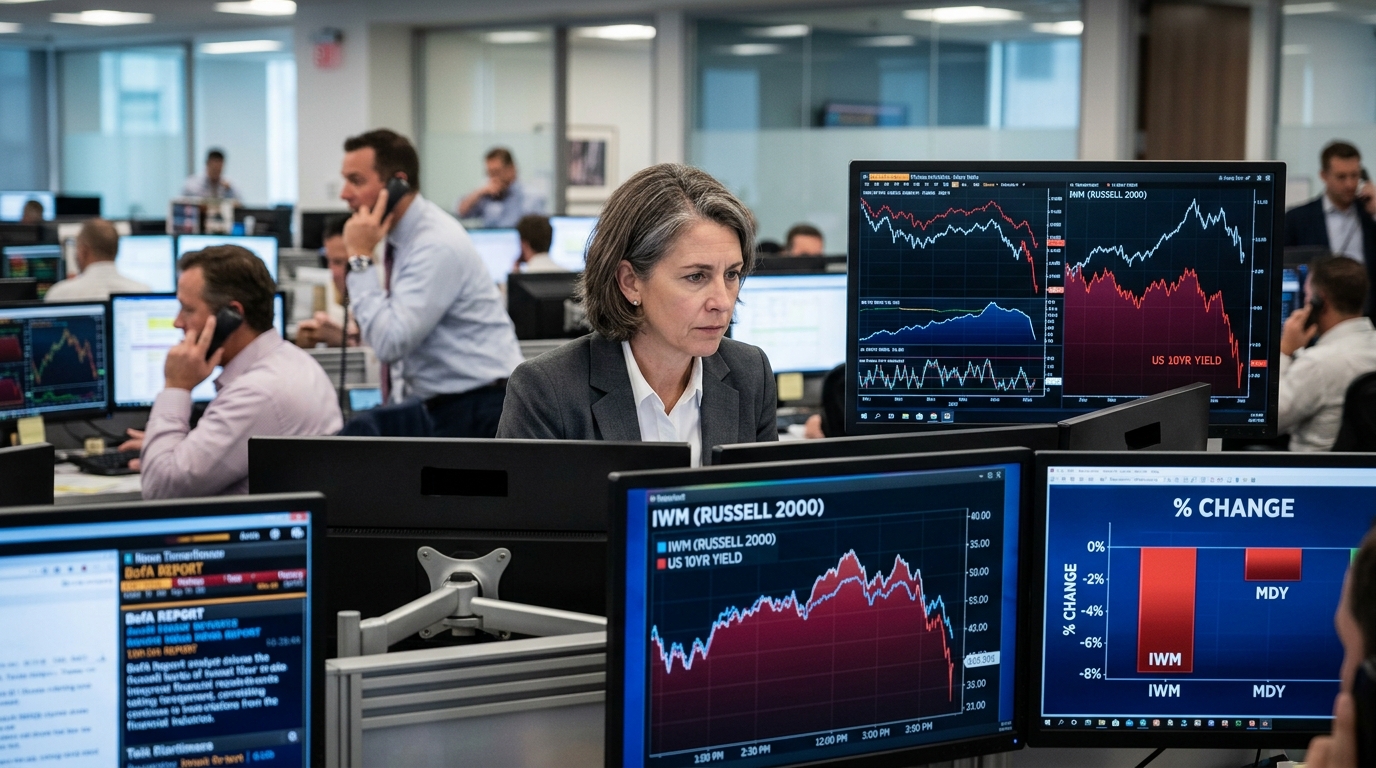
Wednesday, September 23 delivered the clearest stress test of the rate cycle so far. The 10-year Treasury yield rose about 15 basis points intraday and traded around 5.12%, its highest level since July 2007, as strong U.S. activity data and a weak $70 billion five-year note auction reinforced renewed tightening expectations. The Russell 2000 fell 1.8%. The S&P MidCap 400 lost 0.6%. That 120-basis-point gap is not noise.
The macro context makes that spread structural, not episodic. Markets are now pricing elevated odds of additional hikes into year-end. Bank of America expects the federal funds rate to end 2026 in the 4.25%-4.50% range, and Fed Chair Kevin Warsh has shown no sign of viewing current policy as restrictive. The long bond traded at levels consistent with its highest range since 2004 on Thursday morning.
Why IWM Behaves Like a Duration Trade
CNBC reported Thursday that IWM’s correlation to TLT, the 20-plus-year Treasury bond ETF, sits at 0.51, against 0.29 for SPY and just 0.1 for QQQ. Last week, the correlation between small caps and the price of the 10-year note briefly touched a one-year high above 0.97. The Russell 2000’s year-to-date gain has compressed from about 20% to roughly 14% in three weeks, a six-point erosion, while IWM absorbed $3.3 billion in weekly outflows, its second-largest withdrawal of 2026 and third-largest in nine years.
The structural reason is well-documented: estimates put roughly a third of Russell 2000 debt as floating-rate, versus about 6% for S&P 500 companies. When the long end moves hard in a single session, that debt resets faster than earnings do. The index is not just economically sensitive; it is mechanically exposed to rates in ways that mid-cap balance sheets often are not.
Where the Mid-Cap Gap Comes From
The S&P MidCap 400 (MDY) carries a P/E of roughly 20x. Its sector composition, with Industrials around 24%, Technology around the mid-teens, and Financials in the low-to-mid teens, skews toward companies that have more consistent access to term, fixed-rate capital markets than their smaller peers. That balance sheet architecture absorbed Wednesday’s yield spike with less damage.
Bank of America published a Russell 2000 screen on September 23 identifying stocks rated Buy or Neutral that rank well on factors historically outperforming during hiking cycles: quality (strong balance sheets, consistent cash flow) and value. Two names stand out. Madison Square Garden Entertainment (MSGE) posted fiscal 2026 revenue of about $1.1 billion, up about 13% year-over-year, with net income of $66.2 million, about a 77% increase. BofA raised its price target to $96, citing strong cash flow returns in any rate environment. First BanCorp (FBP), the Puerto Rico-based financial holding company, is the other BofA-flagged name. Banks with asset-sensitive balance sheets can benefit from higher rates, and BofA raised its price target to $31 from $29 in late July.
Technical Framework
IWM broke below its 50-day moving average on Wednesday’s session and, at roughly $282, sits near the lower bound of its recent consolidation range. The VWAP from the August high anchors resistance near $293. Volume on the selling day was elevated, consistent with institutional repositioning rather than retail panic. MDY held its 50-day on the same session, a relative strength divergence worth tracking.
For IWM, the next technical test is the June 10 support level. A sustained hold there with declining volume would indicate the flush is complete. A break lower on continued TLT weakness would extend the drawdown toward levels not seen since early Q2.
Scenario Modeling
Bull Case: The October Fed meeting produces a 25-basis-point hike but language signals the end of the cycle. The 10-year stabilizes below 5.00%. IWM reclaims the $290-295 zone as floating-rate pressure abates. MDY outperforms the recovery, given cleaner balance sheets and less short-covering distortion.
Base Case: The 10-year holds in the 5.00%-5.20% range through year-end, consistent with BofA’s year-end rate view. IWM grinds sideways to lower, capped by duration correlation. MDY and quality-screened small caps from BofA’s list, MSGE and FBP, outperform on a risk-adjusted basis.
Bear Case: A disorderly bond auction pushes the 10-year toward 5.40%-5.50%. IWM breaks June support decisively. $3.3 billion in weekly outflows become a self-reinforcing cycle as leveraged small-cap vehicles face margin pressure. Credit events in the unprofitable Russell 2000 cohort surface by Q4.
Active Trader Strategy Framework
The IWM-MDY divergence trade is live. Monitor the spread daily: if MDY continues to hold relative strength while IWM tests lower support, the capital rotation out of rate-sensitive small caps and into mid-cap quality is confirmed. Key levels for IWM are $278 (June support) and $293 (VWAP resistance). For MDY, $665 is the pivot; a reclaim above $675 on volume would be constructive.
Position sizing discipline matters here. Volatility expectations for IWM are elevated, with the TLT correlation at 0.51 meaning any bond auction surprise will transmit directly. Risk frameworks should account for that beta. The BofA quality screen, names like MSGE and FBP, offers an alternative entry for traders who want small-cap exposure without the full duration risk embedded in IWM.
The 10-year near 5.12% is not the end of the story. It is the condition that separates balance sheets. Preparation means knowing which side of that line your holdings sit on.