Quick one.
You can grab my Smart Trade Options Checklist free today – normally $29.97.
It’s a one-page filter. Seven checks. Run it before you place any options trade and you’ll catch the bad ones before they cost you.
Print it. Keep it next to your screen. Use it on every trade.
Download your free copy right here.
Heads up: That link expires soon.
Good Trading,
Bill Poulos
P.S. The download link expires soon. Once it’s gone, the checklist goes back to $29.97. Grab it here.
Kraft Heinz Just Moved to the NYSE. The Dividend Math Is the Real Conversation.
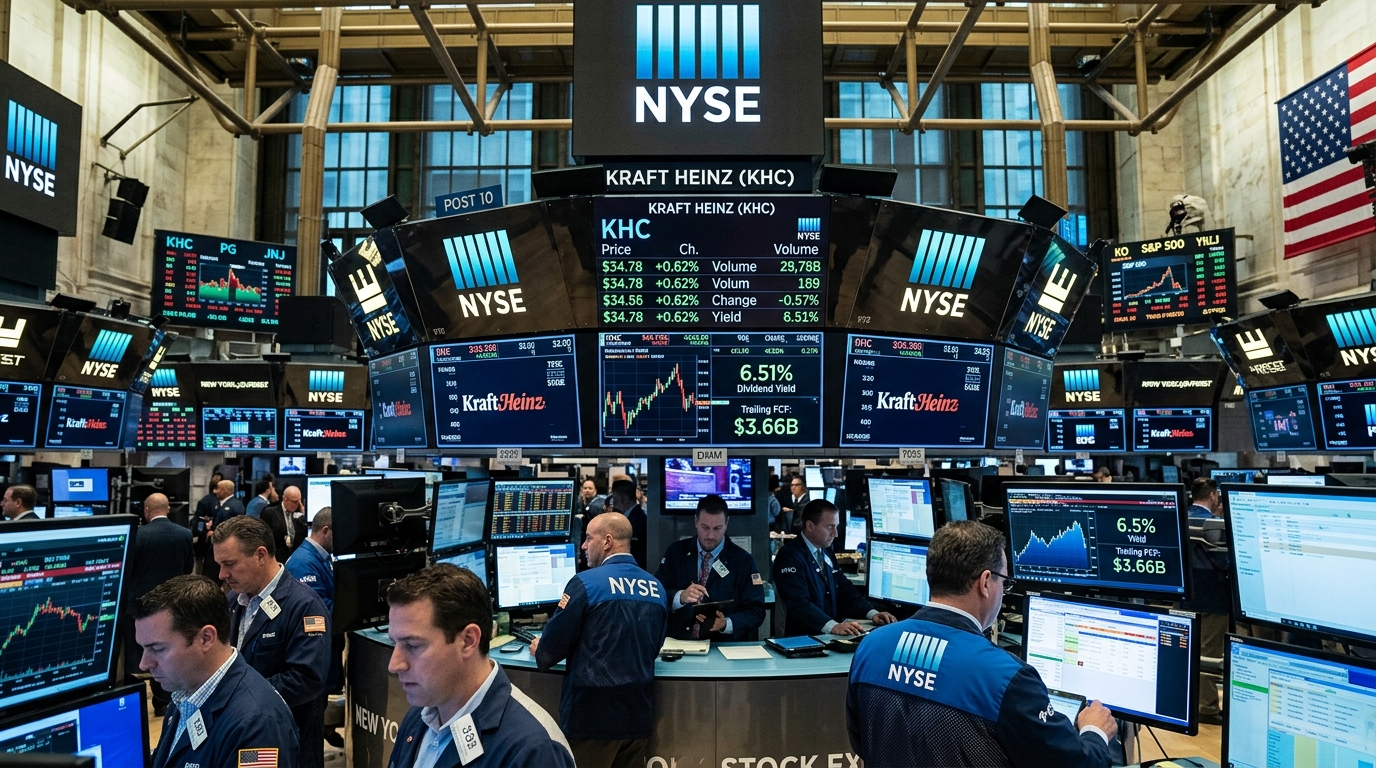
Kraft Heinz trading on the NYSE since September 14 is not a procedural footnote. It is a signal about who management thinks owns this stock now, and who they want owning it next. The ticker stays KHC. The economic terms are unchanged. But the audience being addressed is different: blue-chip income allocators, large-cap consumer staples funds, and the institutional desks that treat NYSE listings as a baseline liquidity requirement.
The numbers that matter most right now are the cash flow figures, not the headline earnings. In the first half of 2026, Kraft Heinz generated $2.1 billion in operating cash flow, up 8.2% year over year, and $1.7 billion in free cash flow, up 10.3%. That FCF funds the $1.60 annual dividend at a payout ratio of roughly 52%, a coverage level that sits comfortably within the range institutional income strategies require before sizing a position. The yield at current prices near $23.85 lands at approximately 6.5%, well above the five-year average of 4.85%.
Q2 2026 results, reported August 5, delivered a fifth consecutive consensus earnings beat. Adjusted EPS came in at $0.56 against a $0.53 estimate, and revenue of $6.26 billion topped the roughly $6.11 to $6.12 billion consensus. Management updated full-year adjusted EPS guidance to a $2.03 to $2.09 range and lifted the organic sales outlook to down 0.5% to down 2.0% from a prior range of down 1.5% to down 3.5%. Emerging Markets grew 10.4% in the quarter, partially offsetting a 2.7% decline in North America.
The stock trades at roughly 12x forward earnings, near the low end of its historical valuation band. Total trailing free cash flow stands at $3.66 billion, a figure that supports not only the dividend but the active debt reduction in progress: the company paid down about $1.9 billion of debt in Q2 and, after quarter close, paid down another $1.0 billion for 2027 maturities. That balance sheet work matters because it expands financial flexibility heading into the November 12 Investor Day, where management is expected to lay out a multi-year volume-led growth framework.
Technical Framework
KHC has traded above its 200-day moving average of $24.03 since early July, a constructive signal for medium-term positioning. The 50-day moving average near $25.45 remains overhead resistance after an August pullback. The 52-week range runs from $21.03 to $28.09, placing current prices near the midpoint. Volume patterns around the NYSE transfer date warrant monitoring: a genuine institutional rotation into consumer staples typically shows sustained accumulation in above-average sessions, not a single-day spike.
Scenario Modeling
- Bull Case: November 12 Investor Day delivers quantitative 2027 and 2028 growth targets that reset the multiple. North American sellout trends, which improved from roughly a 2.5% decline in Q2 to approximately 1% in July, continue narrowing toward flat. KHC re-rates toward $30 to $35 on a combination of multiple expansion and dividend stability.
- Base Case: Organic sales decline stabilizes within the revised guidance band. FCF conversion holds above 110%. Stock consolidates between $22 and $26 into the Q3 earnings window, with income buyers absorbing supply at the low end of the range.
- Bear Case: North American volume declines accelerate beyond guidance. Berkshire Hathaway, which held about a 27% stake as of March 16, 2026, signals a change in posture. Margin pressure from the approximately $700 million incremental investment proves worse than modeled, pushing adjusted EPS below $2.00 and threatening dividend coverage optics near $20.
Active Trader Strategy Framework
The earnings call date for Q3 has not been formally confirmed, but the Q3 earnings window and the November 12 Investor Day are the two hard dates structuring risk around KHC through year-end. Traders sizing exposure around income characteristics should watch free cash flow guidance relative to the $1.60 annual payout, not GAAP earnings, which absorbed a $7.4 billion non-cash impairment in Q2. The 200-day moving average at $24.03 is the key technical floor to monitor on weakness. Volatility positioning ahead of Investor Day may offer asymmetric structure for those with a view on management’s ability to deliver a credible long-term growth framework. Preparation over prediction applies here: the data is visible, the catalysts are dated, and the math around the dividend is transparent enough to model with precision.