
November 5, 2026
Bonus Content: Oil Dropped $9 in Two Days. Airlines Surged. Here Is Where Both Trades Stand Now.
Below is an important message from one of our highly valued sponsors. Please read it carefully as they have some special information to share with you.
Dear reader,
The man who correctly predicted both the housing crash in 2008…
And the Covid crash in 2020…
Is now warning Americans to prepare for an imminent AI meltdown…
And he’s saying you should…
“Avoid Nvidia and buy these “bubble-proof stocks” instead.”
In short, he found a $1.4 trillion ticking time bomb…
That he believes it’s about to go off…
And bring the entire AI industry down…
In a historic meltdown that could trigger an 80% stock market crash…
Wiping out millions of Americans…
Just like it happened during the dotcom bust in 2000.
Click here to see the details and learn how to prepare.
Regards,
Aaron Gentzler
Publisher, Paradigm Press
Oil Dropped $9 in Two Days. Airlines Surged. Here Is Where Both Trades Stand Now.
Bullet Summary
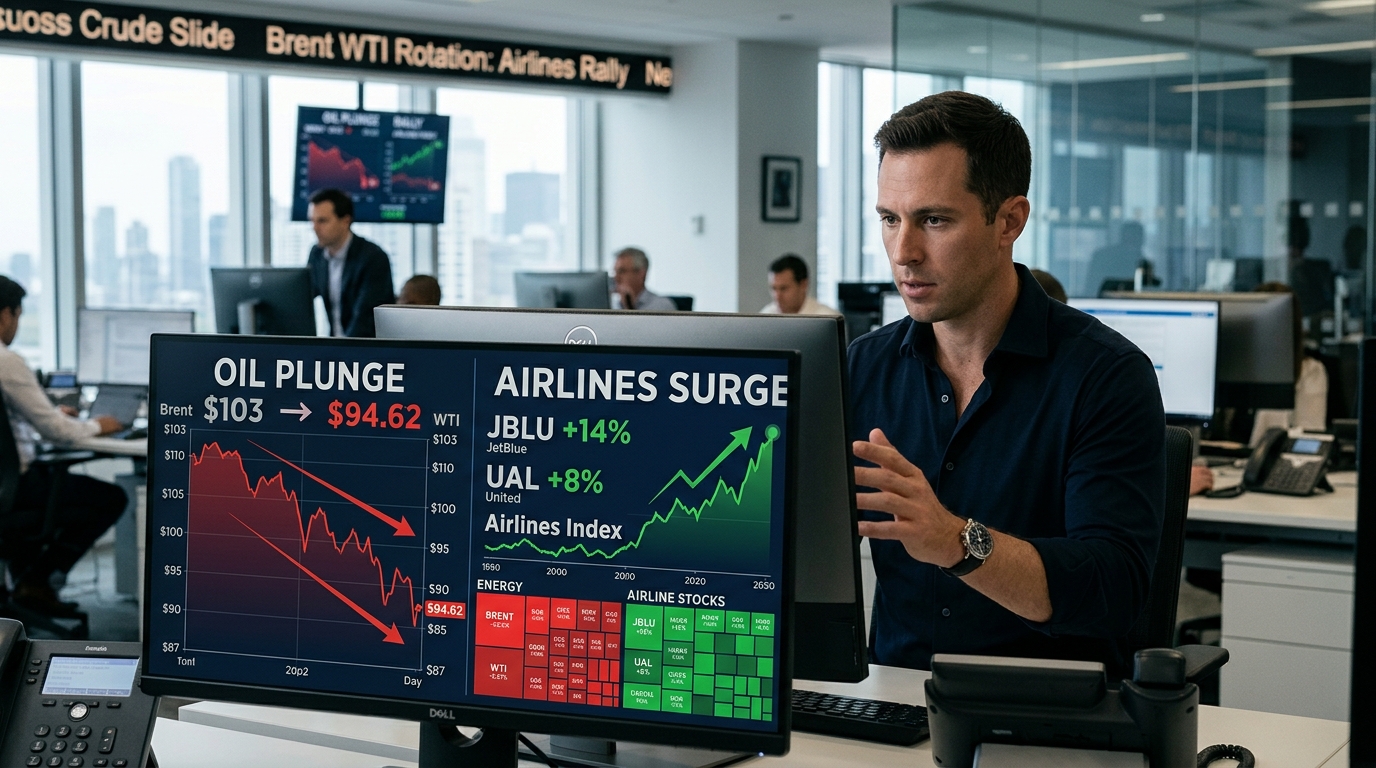
- Brent crude settled at $94.62 on November 4 and traded near the mid-$90s on November 5, extending a sharp two-day drop from above $103.
- WTI traded around $87 on November 5 after an election-driven slide in crude; the key question for traders is whether this is a macro trend shift or a headline unwind.
- JetBlue surged 14% on November 4 (following an 11% gain November 2); United Airlines gained 8.1%, Alaska Air 8.6%, Delta 6.3%, American 6.1%, and Southwest 6.4%.
- ExxonMobil closed at $169.27 on November 4, down 4.62%, on volume 42% above average; Chevron fell about 4% to roughly $215.95 to $216.
- The energy sector fell about 6% on November 4 after Democrats won control of both chambers of Congress, fueling a broad “reduced escalation risk” read-through in oil.
- American Airlines carries no fuel hedge and paid $3.85 per gallon in Q3 2026, up 62.7% year over year; Q4 guidance assumes about $4.70 per gallon.
- JetBlue’s Q4 guidance assumed fuel at $4.64 per gallon and projected an operating loss of 4.5% to 6.5% of revenue for full-year 2026.
Market Context
The catalyst was political, not fundamental. Democrats won control of both the Senate and House in the November 3 midterm elections, and markets read the result as reducing the probability of further U.S. military escalation against Iran. Oil had already gained more than 10% in October as traders priced in post-midterm military risk. That premium unwound fast.
Brent futures plunged as investors wagered that the Democratic sweep could bring pressure to pull back from the Iran war that had upended global energy markets. January Brent settled 8.7% lower at $94.62 on November 4. By November 5, Brent was trading near the mid-$90s and WTI was around $87.
Commercial oil inventories in major consuming countries sit near their lowest levels in 15 years, and uncertainty over diplomatic progress could keep markets volatile. A senior Iranian official told Reuters that Iran and the United States remain far from a deal. That gap between political optimism and diplomatic reality is the central risk for traders positioned on either side of this move.
Sector Breakdown
The rotation was mechanical and total. Every dollar of Brent premium that evaporates directly reduces the revenue line for integrated producers and directly shrinks the cost base for unhedged carriers. Energy stocks including APA, COP, CVX, BKR, HAL, SLB, OXY, and XOM stumbled as oil prices fell hard.
Chevron fell about 4% to roughly $216, stripping roughly $15 billion off an energy major with an approximate $428 billion market cap. ExxonMobil fell 4.6% to $169.27 after DZ Bank downgraded the stock from Hold to Sell; trading volume ran 42% above average. Airlines moved in the mirror image: JetBlue surged 14% while American Airlines and Delta each gained sharply as oil dropped below $100 a barrel.
Stock-Specific Breakdown
JetBlue (JBLU): The leverage is highest here because the balance sheet is thinnest. With total debt of approximately $8.4 billion and carrying no fuel hedge, JetBlue is both a major beneficiary of falling oil and exposed if prices rebound. In Q3 2026, fuel expense was $868 million at $3.91 per gallon, and Q4 guidance assumed $4.64 per gallon. Every $10 sustained drop in Brent materially shifts that Q4 math.
American Airlines (AAL): Fuel was $4.6 billion in Q3 2026, up $1.9 billion, or 67.5%, year over year, driven by a 62.7% increase in the average price per gallon to $3.85. As of September 30, AAL held no fuel hedging contracts and maintains a policy of not hedging, leaving it fully exposed to fuel price fluctuations. The full-year adjusted loss per share guidance stands at ($1.60) to ($1.00), against a more than $7 billion year-over-year headwind from jet fuel.
The contrast between AAL and its peers is sharper than the headline numbers suggest. Delta’s refinery and hedging structure give it a structural buffer that unhedged carriers like American simply cannot replicate.
Delta (DAL) has a structural buffer through its Trainer refinery. The refinery can lower Delta’s jet fuel bill and offset costs through sales of non-jet fuel products. That means Delta’s oil-price leverage, in both directions, is structurally smaller than peers.
ExxonMobil (XOM): Exxon reported $19.1 billion in Q3 free cash flow (non-GAAP), with GAAP earnings of $15.4 billion and cash flow from operating activities of about $25.7 billion. The balance sheet can absorb a prolonged period below $100 oil. The more immediate question is valuation: a price-to-earnings ratio near the high teens means investors are paying a meaningful multiple for earnings that fluctuate directly with the energy cycle.
Technical Framework
Brent’s 50-day moving average sat at $103.82 entering this week. The November 4 close at $94.62 placed it 8.7% below that average. The 200-day moving average is $93.01, and price is now close to that level. That zone is the structural decision point: a sustained break below $93 Brent would signal that this selloff has legs beyond political sentiment. A bounce and reclaim of $98 would indicate short-covering rather than trend change.
For XOM, on November 3, the stock held near $177 with RSI in the low-to-mid 50s, support at $164, and resistance in the high $180s. The November 4 close at $169 cracked the midpoint of that range. The $164 level is now the key: a move below that support would materially damage the uptrend structure. For the airline names, JBLU’s two-day gain of roughly 25% from November 2 through November 4 leaves it extended; a gap fill back toward the November 2 open is the first technical risk level to monitor.
Scenario Modeling
Bull Case (Airlines): Iran and U.S. reach a preliminary ceasefire framework within 30 days. Iranian oil re-enters the market over 60 to 90 days. Brent falls to the $82 to $85 range. At $3.00 per gallon jet fuel, AAL and JBLU both see a path to Q4 breakeven. JBLU tests $4.00. UAL revisits its October highs above $120.
Base Case: Talks stall at the preliminary stage. Brent holds the $90 to $97 range through year-end, with OPEC discipline limiting further downside. Airlines retain a 30 to 40% fuel cost improvement versus peak but do not fully reset their full-year losses. Energy names stabilize near current levels. XOM finds buyers near $164.
Bear Case (Oil Rebound): Diplomacy collapses. A renewed strike risk raises the probability of supply disruption, and Brent gaps back above $105 within days. If Iran diplomacy stalls, oil could rebound quickly and undo the relief lifting airline stocks. JBLU gives back its entire two-week gain. XOM and CVX reclaim their early November highs.
Active Trader Strategy Framework
The asymmetry matters. For airline longs, the catalyst is political, which means it can reverse without warning on a single headline. Position sizing should account for that binary character: a 10% allocation with defined stop levels at the November 2 open prices is a disciplined framework. Avoid adding to JBLU above $3.50 without confirmation that Brent is holding below $95.
For energy names, the question is not whether Q3 earnings were strong, they were. The question is what multiple the market assigns at $94 oil versus $110 oil. Chevron faced profit-taking despite surpassing Q3 earnings estimates, as management prioritized balance sheet preservation and declining crude prices compounded institutional ETF outflows. Traders watching CVX should anchor entries to the $212 to $215 range, where both price and volume indicate contested territory.
Conclusion
Two sessions erased a large chunk of geopolitical premium from oil and handed airlines their sharpest rally of the year. The underlying drivers are political, the Iran war and its diplomatic trajectory, not demand or supply fundamentals. Disciplined traders know that political risk premiums are the most volatile and least predictable inputs in any model. The levels that matter are Brent $93 to the downside and $98 to the upside, XOM $164, and JBLU $3.50. Watch those before the next headline moves the board.