July 24, 2026
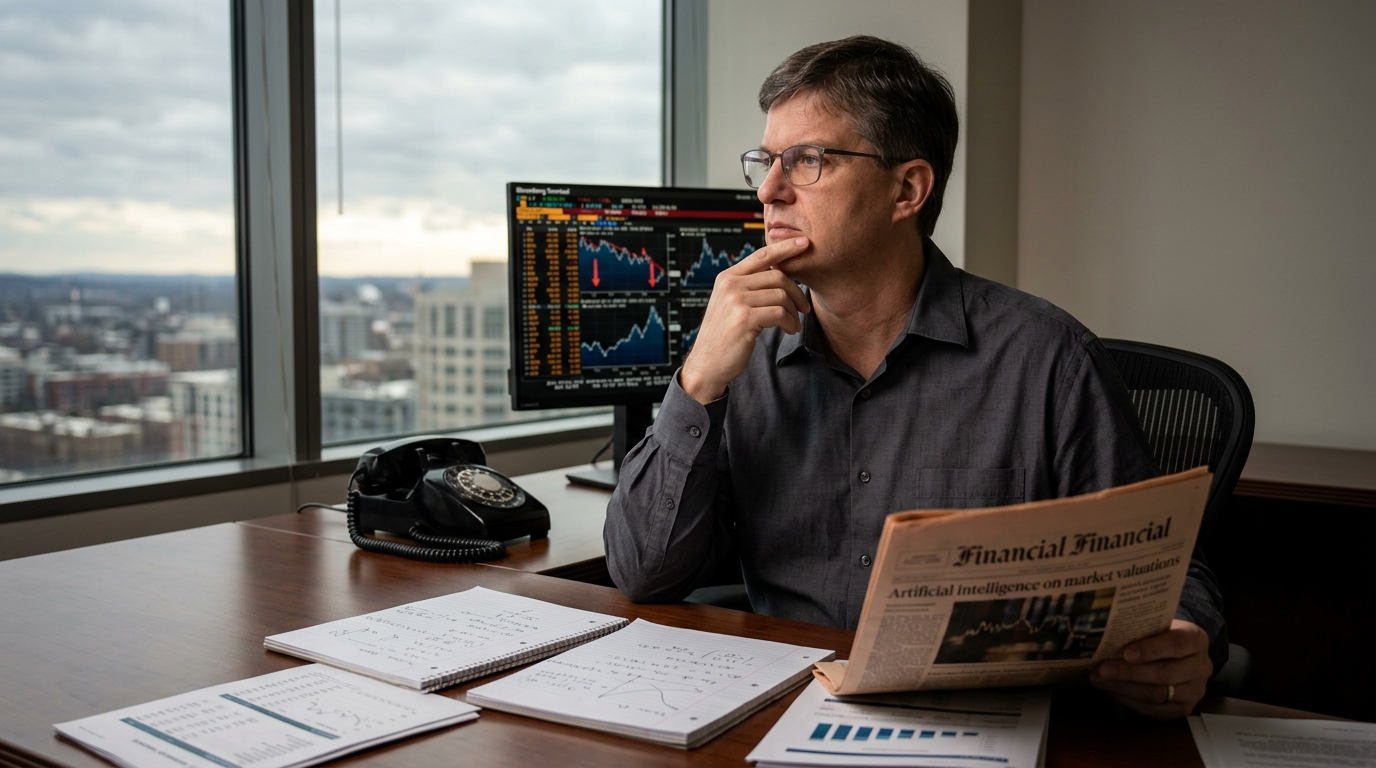
Burry Says It Feels Like 1999
Featured: Burry Says It Feels Like 1999
The REAL Reason 2,000 Missiles Rained on Iran
For a moment…
Forget about terrorism.
Forget about oil prices.
Forget about everything the evening news has been telling you.
Because after two private meetings with United States Congressmen on March 2nd – and weeks of digging into what those conversations pointed me toward – I’m now convinced we launched those strikes for a completely different reason.
Click here to find out what it is.
If you have even a single dollar invested in the U.S. stock market, what I’ve uncovered is going to directly impact you – starting August 12th.
Discover the real reason here.
Burry Says It Feels Like 1999
Michael Burry said it plainly: “Feeling like the last months of the 1999-2000 bubble.”
That wasn’t a casual observation. It was posted on Substack on May 8, 2026, after Burry spent a long drive listening to financial radio coverage and was struck by what he called a powerful sense of familiarity. His exact words: “With what is happening in the market the last week, that I had lived this before suddenly dawned on me.”
He’s not alone. Paul Tudor Jones told CNBC on May 7 that the current environment reminded him of 1999 — the last strong year before the dot-com collapse. The warning is no longer coming from the fringes.
Market Snapshot: The Numbers Right Now
Here’s where things stand as of July 24, 2026:
- S&P 500: Around 7,408, down 1.21% on Thursday’s session. The 50-day moving average sits near 7,470 — the index recently fell back below it.
- Nasdaq Composite: Near 25,138, off more than 2% on the session. The Nasdaq is the pressure point.
- Dow Jones Industrial Average: Around 51,712. Paradoxically still holding near record territory — a textbook divergence signal.
- VIX: Closed at 18.70 on July 23, up 12.38% in a single session. The 52-week range is 13.38 to 35.30. A sustained move above 20 matters.
- 10-Year Treasury Yield: 4.71% as of July 23 — the highest level since January 2025 and rising for a fourth consecutive session, driven by surging oil prices and geopolitical stress.
- Fed Funds Rate: Currently 3.63%, with the FOMC meeting July 28-29. Markets are now pricing in a greater than 33% chance of a rate hike at that meeting, with the probability of a September increase above 78%.
- Shiller CAPE Ratio: 41.37 as of July 2026 — up 10.4% year over year and sitting above 40 continuously since May. That has happened exactly once before in history: January 1999 through September 2000.
Let that last point land. The CAPE ratio, which uses 10 years of inflation-adjusted earnings to gauge valuation, is nearing 42. The record high was 44.2 — reached during the peak of the dot-com bubble. We are not close to normal. We are not close to elevated. We are in territory that has existed in only one prior sustained period in market history.
Will You Survive the MAR-A-LAGO RESET?
Bloomberg calls it “a dire shift of fortunes for America” and The Wall Street Journal calls it a “New World Order.” Now, Dr. David Eifrig – a 40-year market veteran who traded through Black Monday and has recommended more than a dozen triple-digit winners – warns that you must make one of the most important financial decisions of your lifetime today.
He strongly recommends this ONE step to potentially secure your retirement.
The Burry Thesis: What He’s Actually Saying
Burry’s concern is not simply that stocks are expensive. It’s more specific than that. His argument centers on the structure of market behavior right now — the single-theme fixation, the momentum-only price action, the way everything else has been crowded out.
“Absolutely non-stop AI. Nobody is talking about anything else all day,” he wrote after that long drive. “Stocks are not up or down because of jobs or consumer sentiment. They are going straight up because they have been going straight up. On a two-letter thesis that everyone thinks they understand.”
His most pointed statistical comparison: the Philadelphia Semiconductor Index rose more than 10% in a single week ending May 8, pushing its 2026 gains to approximately 65% at that point. Burry compared that velocity directly to the parabolic price action in semiconductor and technology stocks in the months immediately before the Nasdaq peaked and then collapsed in March 2000.
And then the AI trade cracked.
On July 7, 2026, the VanEck Semiconductor ETF (SOXX) plunged 5.1% in a single trading session — one of the steepest single-day drops for the sector in recent memory. Broad selling pressure hit nearly every major chipmaker. Meanwhile, the Dow paradoxically reached record territory above 53,000. The divergence between semis and industrials is a pattern traders need to understand: it is not random noise. It is capital moving.
What Burry Is Actually Doing With His Money
This isn’t just commentary. Through Scion Asset Management, Burry disclosed put option positions with a combined notional value of approximately $1.1 billion — $912 million against Palantir (PLTR) and $187 million against Nvidia (NVDA). Those are the Q3 2025 numbers. Since then, he has expanded the positions.
More recent disclosures from early 2026 show Burry adding short positions on the SOXX semiconductor ETF, the QQQ Nasdaq 100 ETF, Oracle, and Tesla. Nearly 80% of his known portfolio is allocated to bearish positions on AI-related names.
His Palantir short has already generated significant returns. Palantir shares were at $200.47 at the end of Q3 2025. By June 9, 2026, they had fallen to $132.07 — a 34% decline.
Slight tangent, but it matters: Burry has also been clear about what he’s buying on the long side. In his Substack, he described “patiently acquiring” companies the market had moved away from — a mirror of the value plays he identified after the dot-com bubble began to unwind in 2000. That’s the other half of his call that most people skip over.
Sector Breakdown: Where Capital Is Moving
The AI-driven bull market that dominated Wall Street for nearly three years is showing meaningful stress as of July 2026. The key structural shift: correlation between hyperscalers and semiconductor stocks has broken down sharply.
A year ago, investors could look at the S&P 500 technology and communication services sectors on any given day and have a fair idea how both AI spenders and chip firms performed. Correlation between the PHLX Semiconductor Index and the hyperscalers reached nearly 1.0 in early 2025 — almost perfect lockstep. That dynamic has changed dramatically. Alphabet and Tesla both fell recently as investors punished them for AI spending levels, while chip stocks initially moved differently. The lockstep is gone.
Meanwhile, capital has been rotating. The Dow hitting record highs while the Nasdaq sold off is the clearest visual signal of rotation into industrials, financials, and defensive sectors. The Russell 2000 is up nearly 6% over the last three months, outpacing the S&P 500 Equal Weight Index. Small caps outperforming mega-caps is not a bull signal for tech — it is a reallocation signal.
NVIDIA maintains a commanding 70-80% market share in AI chips and trades at 32x trailing earnings. AMD trades at approximately 175x trailing earnings — a significant premium that assumes sustained hypergrowth. NVIDIA has recently completed a $25 billion bond offering as it ramps Blackwell AI systems production through 2026. These are not cheap stocks. Any indication that hyperscaler AI capital expenditure is plateauing, or that AMD’s MI400 series is gaining meaningful share, could compress multiples significantly even if absolute earnings remain strong.
Alphabet just raised its FY2026 capital expenditure guidance — and the market sold it off. That is a different reaction than what we saw 12 months ago. Expectations are shifting, even if slowly.
The Bull vs. Bear Case on the AI Theme
There is a serious counterargument to Burry’s call, and active traders need to understand it rather than dismiss it.
The most important difference between 2026 and 1999: the leading AI companies are genuinely profitable. Microsoft, Alphabet, and NVIDIA generate billions in earnings and possess real pricing power. During the dot-com era, numerous internet companies had little or no earnings and limited revenues. Today’s dominant tech firms are among the most profitable corporations in history. That matters for valuation support.
Burry has also been wrong before — and has said so publicly. “I am now a meme for the number of times I have called a crash,” he wrote. “I have become the boy who cried wolf.” He also noted: “Still, I got it right in 2000, got it right in 2007. Got it right in 2019, helped by COVID, and I called the meme stock crash in mid 2021.” His track record at identifying the genuine inflection points — even if the timing is imprecise — is difficult to dismiss entirely.
The more nuanced read: Burry may not be calling an imminent catastrophic collapse. He may be identifying a regime change — a period where the single-theme AI momentum trade loses its singular dominance and markets become more stock-specific and sector-rotational. That is already beginning to happen.
Technical Structure: What the Chart Is Telling Traders
The S&P 500 has fallen back below its 50-day moving average, now near 7,470. The 100-day moving average sits at approximately 7,172 — well below current levels, providing a secondary support reference. The 52-week range on the S&P 500 runs from 6,212 to 7,620. Current price action puts the index in the upper half of that range but below recent highs.
The VIX at 18.70 is elevated relative to where it was through most of mid-2026, but it is not yet in the 20-30 range that signals rising structural uncertainty. The VIX jumped 12.38% in a single session on July 23. Watch for a sustained close above 20 — that level changes the positioning calculus for short-duration traders. A move toward 25-30 would represent a genuine regime shift in volatility expectations.
On the Nasdaq, the pattern to watch is the relationship between recent highs and the 50-day moving average. Any failed rally attempt that stalls at or below the 50-day is a bearish signal for short-term momentum traders. Volume matters: distribution days — sessions where the index closes lower on higher volume than the prior session — are the institutional footprint of selling into strength. Count them carefully over the next two weeks.
SOXX has already shown one of its sharpest single-session declines in recent memory. After a 65% run in 2026 into early May, the velocity of that kind of move historically precedes periods of consolidation or reversal. Support and resistance levels on SOXX are now critical reference points for anyone trading semiconductor names.
SpaceX ‘Dark Energy’ Replaces Foreign Oil
For years, we’ve been told SpaceX is a rocket company. But according to new satellite images from 300 miles above the Earth’s surface, there is something very strange going on at SpaceX right now that has nothing to do with space. It could soon replace our need for foreign oil forever and ignite a $10 trillion boom for the stocks involved.
Scenario Modeling
Bull Case: The Fed holds rates steady at the July 28-29 meeting, oil prices stabilize, and mega-cap earnings — particularly from NVIDIA, Amazon, and Meta reporting over the next two weeks — come in above expectations. If hyperscaler capital expenditure continues to accelerate and NVIDIA’s Blackwell ramp delivers the revenue growth priced into the stock, the AI trade stabilizes. The S&P 500 recovers above 7,470, and the Nasdaq reclaims its 50-day moving average. SOXX bounces off its recent lows and begins to rebuild the uptrend. In this scenario, Burry’s timing proves premature — again — and the market grinds toward the S&P 500’s prior high near 7,620.
Base Case: Markets remain choppy through August as earnings season produces mixed signals across hyperscalers and chipmakers. The correlation breakdown between semis and mega-cap tech continues. Capital rotation into industrials, financials, and small caps accelerates. The S&P 500 holds the 7,200-7,400 range. The AI theme does not collapse but does narrow — only the companies with clear near-term revenue from AI infrastructure investment hold up. This is the most probable outcome for the next one to five sessions: volatility elevated, sector rotation active, stock-specific moves dominating.
Bear Case: The Fed signals a rate hike at the July 28-29 meeting, or hints at one for September. Oil prices remain elevated, feeding inflation expectations. One or more of the major hyperscalers — Alphabet, Microsoft, Amazon, Meta — miss earnings or guide lower on profitability. The VIX surges above 25. The S&P 500 breaks below its 100-day moving average near 7,172. SOXX tests multi-month lows. In this scenario, Burry’s dot-com comparison becomes the dominant market framework, and the unwinding of leveraged momentum positions accelerates. The Nasdaq could test 23,000-24,000 in a compressed move.
Active Trader Strategy Framework
What this environment calls for is not a binary bet on Burry being right or wrong. It calls for precision and awareness of the specific risks in play right now. Here’s the framework for the next one to five sessions:
- Watch the VIX threshold at 20. A sustained close above 20 changes the risk environment for short-term positioning. Options volatility pricing shifts, and momentum strategies that worked in a sub-18 VIX world become less reliable.
- Track the S&P 500 vs. its 50-day moving average near 7,470. A recovery above that level — on meaningful volume — is constructive. A failed recovery below it is the first confirmation of a more serious deterioration.
- Monitor the FOMC meeting July 28-29. Any hawkish surprise — even language hinting at a rate hike — will matter for high-multiple tech stocks far more than it will matter for industrials or financials. The Fed is the single biggest near-term catalyst.
- Watch sector divergence closely. If the Dow and Russell 2000 continue to hold up while the Nasdaq sells off, that is a rotation signal, not a panic signal. The playbook shifts to value, cyclicals, and small caps — not to cash.
- Track earnings from hyperscalers carefully. Not just the top-line number. Watch capital expenditure guidance. Watch margin commentary. The market is now punishing high AI spending rather than rewarding it — Alphabet’s stock reaction to its raised CapEx guidance was a warning shot.
- Risk management is the priority. In a high-CAPE, elevated-VIX, rising-yield environment, position sizing matters more than conviction. The reward structure for concentration in high-multiple names is asymmetric to the downside if any of the three macro variables shifts sharply.
Trader’s Checklist for the Next Five Sessions
- Does the S&P 500 reclaim or fail at the 50-day moving average near 7,470?
- Does the VIX close above 20 on a sustained basis?
- What does the FOMC signal on July 28-29 regarding rate trajectory?
- How do hyperscaler earnings — Alphabet, Microsoft, Amazon, Meta — respond to capital expenditure scrutiny?
- Is SOXX finding a floor, or are distribution sessions continuing?
- Is small-cap and industrial outperformance versus Nasdaq continuing to widen?
- Are 10-year Treasury yields stabilizing or continuing their move toward 5%?
Michael Burry has been early before. He may be early again. But the data he’s pointing to — a Shiller CAPE ratio of 41.37 seen only once before in history, a semiconductor index that rose 65% in months, a market fixated on a single two-letter theme to the exclusion of everything else — these are not manufactured warnings. They are observable, measurable, and now being confirmed in real-time price action.
The question for active traders is not whether Burry is right on the timeline. The question is whether the risk/reward profile of the AI momentum trade justifies the position sizing decisions currently in place across most portfolios.
Prepare, don’t predict. Know your levels. Know your exits. The market will tell you what it needs to tell you in the next five sessions.
For informational and educational purposes only. Not investment advice. Trading involves risk, including loss of principal.