
July 29, 2026
SOFI Beat. The Stock Still Fell.
Featured: SOFI Beat. The Stock Still Fell.
Dear Reader,
Do you hold any of these AI stocks?
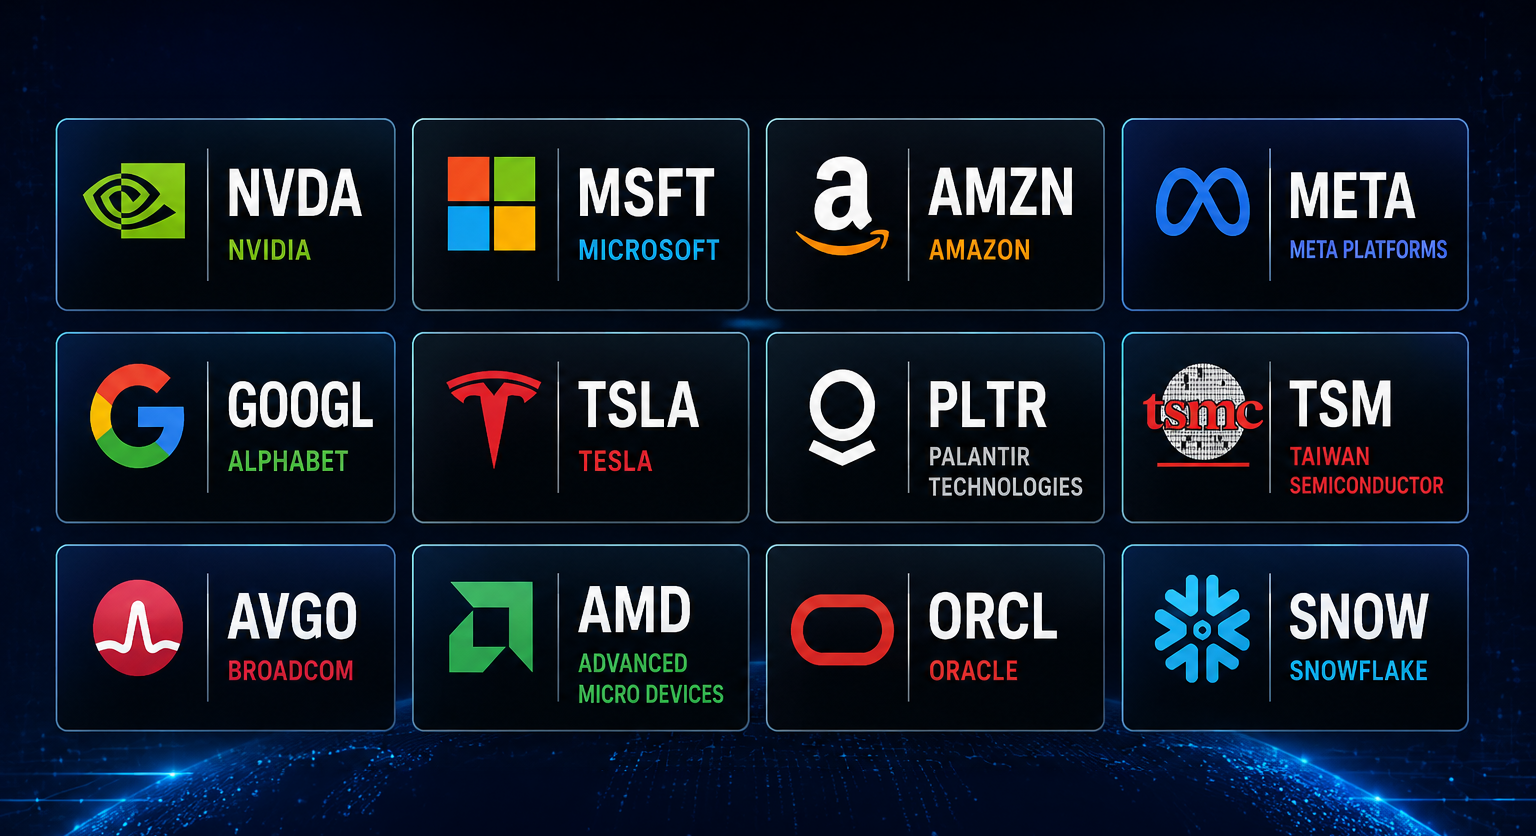
Wall Street insider Jason Bodner – the man who called Nvidia at $4.50 – says today’s AI stocks are about to hit a wall.
And a completely different group of AI firms… names Wall Street is starting to ignore… are about to take off.
This has nothing to do with SpaceX…
A new chatbot…
Autonomous robots…
Or anything you’re likely hearing about.
It has to do with a brand-new “light-speed” device turning AI as we know it into “Accelerated AI”…
Making it 100 times faster…
And 100 times more energy efficient – right here, on Earth.
Already, some of the biggest tech investors like Elon Musk, Mark Zuckerberg, Cathie Wood, and Bill Gates are moving money into it.
Just to name a few…
They’re all moving money to prepare for what’s coming.
But you won’t hear anything about it in the mainstream news…
In fact, TV pundits spent most of this past year talking about AI worries and its “existential risk” to jobs…
Or arguing whether we’re in an AI bubble and when it would pop…
That’s why most Americans won’t see it coming until it’s too late.
Don’t be one of them…
Because if you’re holding the wrong AI stocks when “Accelerated AI” goes mainstream…
You could spend the next decade just trying to claw back to even…
But if you make the one move Jason reveals in this urgent video message…
The next 12 to 24 months could hand you bigger gains than the entire AI boom of the last three years.
Click here to hear the full story and get ahead of the crowd.
But hurry, because this opportunity won’t stay hidden much longer.
We have so much to look forward to,
Jeff Brown
Founder & CEO, Brownstone Research
P.S. Jason also shares details on 10 popular AI stocks he says you must dump before this shift goes mainstream. Names sitting in millions of 401(k)s, IRAs, and brokerage accounts. Click here to see if yours made the list.
SOFI Beat. The Stock Still Fell.

Market Snapshot
The broader market is grinding near highs, but underneath the surface the environment is becoming more selective. Growth stocks are not getting the same lift they were earlier in the year. Fintech specifically has been under institutional pressure since early 2026, with the sector trading as a group rather than rewarding individual execution. That context matters a great deal for how you interpret what happened with SOFI this morning.
The Fed held its target range steady at 3.50% to 3.75% at its most recent meeting, and rate expectations for the back half of 2026 remain mixed. That has kept a ceiling on fintech multiples even as underlying business results have improved. Volatility is relatively contained at the index level, but stock-specific moves around earnings have been sharp and often counterintuitive. This is a tape that rewards preparation over reaction.
Bottom line on the environment: conditions favor stock-specific trading around earnings catalysts, with particular attention to how price reacts to news rather than what the news itself says. SOFI is the clearest example of that dynamic right now.
Why SOFI Is in Focus
SoFi Technologies just posted one of the stronger fintech earnings reports of the year. Q2 2026 net revenue hit a record $1.21 billion, up 43% year over year, beating the $1.13 billion consensus. Adjusted EPS of $0.12 topped the $0.11 estimate. EBITDA came in at $358 million against $333 million expected. Loan originations jumped 69% year over year to $14.8 billion. Net income climbed 61% year over year. The member base reached 15.8 million, a 35% year-over-year increase.
Management raised full-year 2026 revenue guidance to $4.75 billion to $4.85 billion, above both the prior range and the $4.70 billion analyst consensus. CEO Anthony Noto flagged a milestone that had never happened before at the company: SoFi added twice as many new products as new members in the quarter. That is a cross-sell inflection that matters for long-term unit economics.
And the stock dropped roughly 5.68% in premarket anyway.
That reaction is the reason SOFI is on the radar today. When a stock falls on a clear beat, the question is not whether the business is good. It clearly is. The question is whether the selling represents distribution, disappointment on something specific, or simply a market that already moved ahead of the numbers. Figuring out which of those is driving the action determines how you approach the next one to five sessions.
Iran War TRUTH: What Was Revealed Behind Closed Doors
There’s a strategy behind the Iran war.
I know because I heard it directly in a closed-door meeting with a source whose connections run deep into global power networks.
He walked me through the real purpose and the massive deal tied to it.
Technical Picture
SOFI entered earnings in a well-defined downtrend. The stock had lost roughly 40% year to date and was sitting near multi-month lows around $15.78 in premarket. The trend is bearish on every meaningful timeframe. Lower highs, lower lows, and persistent selling on any bounce attempt have been the dominant pattern throughout 2026.
The key support level to watch is $15.00 to $15.50. That zone has acted as a floor during prior selling waves, and a close below it on meaningful volume would be a technically significant development. It would suggest the post-earnings reaction is not a shakeout but a continuation of the broader downtrend.
On the upside, the first meaningful resistance sits near $17.00 to $17.50, a level SOFI struggled to clear in prior recovery attempts. Above that, $19.00 becomes relevant as the next technical ceiling, with analyst consensus targets clustering in the $21 to $22 range representing the larger potential recovery zone.
Momentum indicators are weak. The stock has not shown a sustained period of relative strength versus the broader market or its fintech peers in 2026. Volume on the post-earnings decline will be the first tell: heavy distribution on the flush would be a red flag, while a low-volume pullback that holds the support zone would suggest sellers are not pressing aggressively after the initial reaction.
Catalyst
The earnings beat is the headline catalyst, but the more durable driver over the next several sessions is the guidance raise and what it implies for H2 execution. Management is targeting an adjusted EBITDA margin of approximately 38% in the back half of 2026, compared to roughly 30% in H1. That ramp requires the company to deliver approximately $259 million per quarter in adjusted net income during Q3 and Q4, a roughly 56% step-up from Q2 levels. That is an aggressive target, and the market will be watching every data point for evidence it is achievable.
The deposit base remains a structural catalyst that does not get enough attention. With deposits at $40.2 billion representing over 90% of average liabilities, SoFi’s funding cost advantage versus warehouse borrowing is estimated at over $620 million annually. That edge compounds as the loan book grows.
One drag that kept the reaction muted: the Technology Platform segment fell 23% year over year to $84.5 million, reflecting a large client departure before year-end 2025. Until that segment shows signs of stabilizing, it will continue to cloud the overall growth picture for institutional buyers who care about every line of the model.
What keeps this catalyst relevant beyond today: the next scheduled catalyst is the Q3 earnings report, which means the stock will trade on sentiment and sector dynamics for the next several weeks. That creates a window where price action around the current support zone may tell you more than any single data point.
Pilots Use One. Smart Traders Should Too.
A pilot never takes off without running a checklist. Not because they don’t know how to fly – because they know that the moment something feels routine is the moment a step gets skipped.
Options trading punishes skipped steps faster than almost anything else. So, I put the 7 that matter most on one page.
It’s called the Smart Trade Options Checklist. Normally $29.97. Free today.
Run it before any options trade. Takes about 30 seconds. You’ll catch the bad ones before they cost you.
Risk Assessment
The primary risk is straightforward: SOFI has been in a persistent downtrend all year and has already shown a willingness to ignore good news. A stock that drops on a beat is telling you something about the character of the sellers. It may be that short-term traders who bought ahead of earnings are simply taking profits. It may be that institutional holders are using the liquidity event to reduce exposure. The post-earnings session will help clarify which scenario is more likely.
- Support break risk: A close below $15.00 on volume would invalidate the idea that this is a post-earnings overreaction and suggest the path of least resistance remains lower.
- Charge-off deterioration: Any rise in net charge-offs in the personal loan or refinancing book would challenge the earnings growth story quickly and likely accelerate selling pressure.
- H2 margin miss: If Q3 results show EBITDA margins tracking below the 38% target, the guidance raise will look premature and the stock will reprice lower.
- Fintech sector pressure: SOFI does not trade in isolation. Continued institutional rotation away from growth and fintech broadly would be a headwind regardless of company-specific execution.
- Fed policy surprise: An unexpected hawkish shift in the rate outlook would directly compress SoFi’s net interest income trajectory and the multiple the market is willing to assign the business.
Trader’s Checklist
Before acting on SOFI in either direction over the next one to five sessions, here is what to monitor:
- Does $15.00 to $15.50 hold? This is the most important near-term variable. A low-volume hold of support opens the door for a recovery attempt toward $17.00. A high-volume break below $15.00 signals continuation lower and shifts the focus to the downside.
- Post-earnings volume profile: Watch whether volume on the declining sessions is heavy or light. Distribution-style volume on down days is a bearish signal. Declining volume on weakness suggests sellers are not aggressive and a base may be forming.
- Earnings call tone on H2 margins: Read the transcript carefully for any softening of language around the 38% EBITDA margin target for H2. Any hedge or caveat in the commentary would be a near-term negative catalyst.
- Fintech sector peers: Watch how FINX and IPAY trade over the next several sessions. If the sector starts recovering alongside SOFI, it adds conviction to the recovery thesis. If peers continue to underperform, SOFI is fighting two headwinds at once.
- Analyst revisions: With the stock sitting 30%-plus below consensus price targets, watch for any analyst upgrades, target increases, or initiation of coverage in the days following the report. Fresh institutional interest triggered by the earnings beat could be an early signal that the dislocation is being noticed by larger buyers.
Noto called 2026 a defining year. Two quarters in, the business is executing. The stock has not agreed yet. That gap is where the opportunity lives, but the chart says you need confirmation before stepping in front of a trend that has been moving in one direction all year.