July 23, 2026
Big Tech Breaks. Energy Runs.
Oil at $100 reshapes the market. Here is what traders need to know right now.
Active Trader Daily | July 23, 2026
Thursday was one of those sessions that clarifies things. Not because of a single headline, but because multiple forces collided at once, and the market’s reaction told you something important about where expectations are actually shifting right now.
Big Tech just delivered two of the most-watched earnings reports of the season. Both beat on revenue. Both got sold hard anyway. Meanwhile, energy stocks moved quietly higher, Treasuries sold off to levels not seen since early 2025, and federal funds futures began aggressively pricing in a September rate hike that almost nobody was talking about a week ago. That is a lot happening in one session. Active traders who focus on where expectations are changing, not just what happened, have a clear picture to work with over the next several sessions.
Market Snapshot
The broad indexes fell hard today. The S&P 500 dropped roughly 1.4%, the Nasdaq Composite lost approximately 2.3%, and the Dow Jones fell over 540 points. That is not a minor shakeout. Decliners outnumbered advancers on the NYSE by 1.26-to-1, and on the Nasdaq by 1.86-to-1. Volume came in below the 20-session average at around 15 billion shares, which is worth noting because it means the selling was orderly, not panic-driven. That distinction matters when you are trying to assess whether a move has legs or is simply a one-session air pocket.
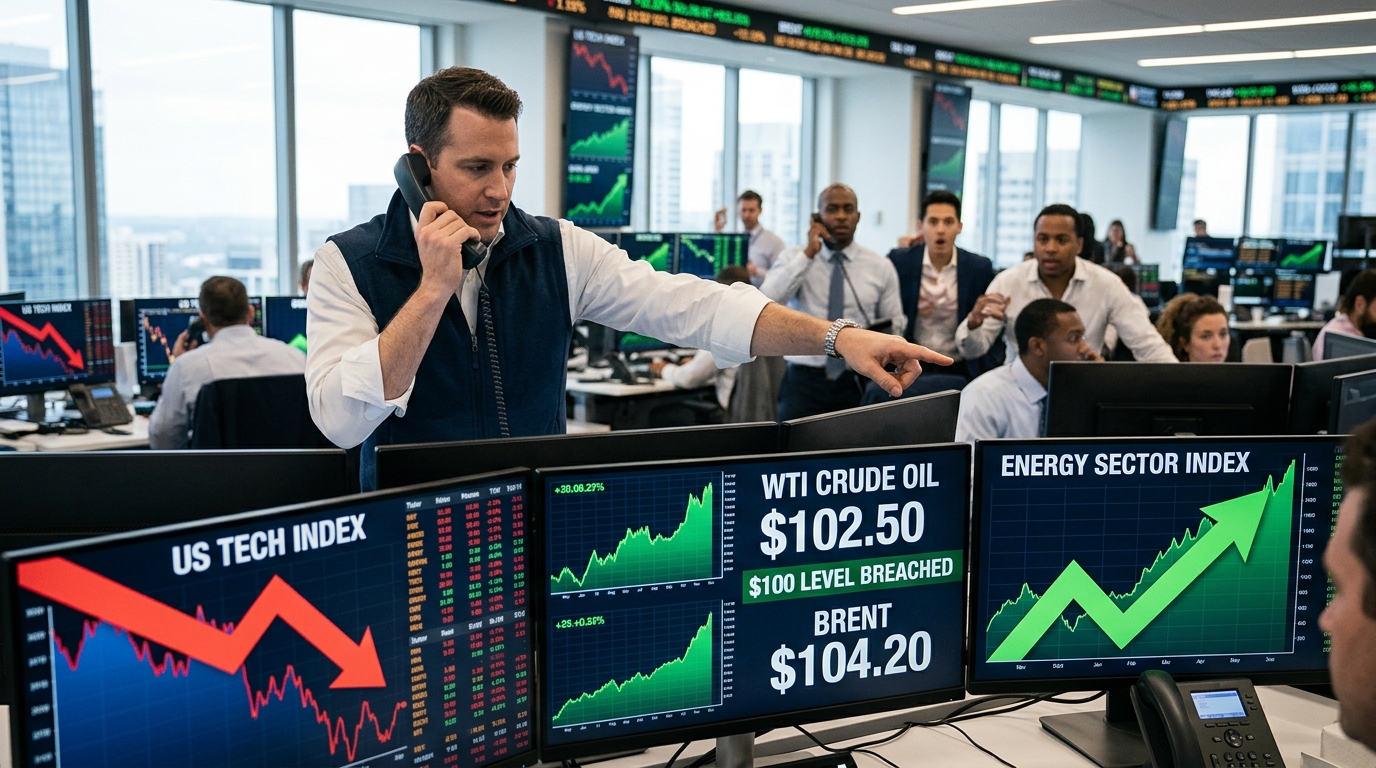
The headline driver was Brent crude oil crossing $100 per barrel, its first time above that psychological threshold in nearly two months. WTI crude advanced roughly 6% to settle near $92 per barrel. The catalyst: Iran-backed Houthi rebels attacked tankers in the Red Sea, the U.S.-Iran conflict escalated further, and fears of disruption through the Strait of Hormuz intensified. Oil is the center of gravity right now. Everything else is orbiting it.
The 10-year Treasury yield rose to 4.71% Thursday, its highest level since January 2025. Before the conflict with Iran began in late February, that yield was sitting below 4.00%. The 2-year note climbed roughly six basis points to around 4.36%. The bond market is not panicking, but it is clearly repricing the probability that the Federal Reserve will act to contain inflation driven by an energy shock.
Jim Rickards: “This AI Company is the Next Lehman Brothers”
Jim Rickards just found this HUGE RED FLAG for AI stocks…
And you need to prepare now…
Because the last time he saw something like this was in 2008…
Three weeks before Lehman Brothers went under, triggering a market panic.
He believes this major AI company will go bust…
In a crisis that could be 10 times bigger than Lehman Brothers.
- S&P 500: Dropped approximately 1.4% on the session
- Nasdaq Composite: Lost approximately 2.3%, weighed by Alphabet (-6%) and Tesla (-14%)
- Dow Jones: Fell roughly 541 points
- Brent Crude: Crossed $100/barrel intraday; settled at approximately $100.69
- WTI Crude: Advanced roughly 6% to approximately $92.19/barrel
- 10-Year Treasury Yield: Rose to 4.71%, highest since January 2025
- VIX: 16.64 as of Wednesday close, down 2.4%, suggesting fear is contained but not absent
- Fed Rate Hike Odds (September): 82% probability per CME FedWatch, up from 52% just one week ago
- Weekly Jobless Claims: 187,000 for the week ended July 18, well below the 212,000 forecast
The VIX at 16.64 is not a screaming fear reading. That is the part of today’s session that deserves attention. Stocks fell sharply, oil surged, bonds sold off, and the fear gauge barely moved. That tells you the selling was concentrated in a specific cohort, mainly mega-cap tech, rather than a broad systemic unwind. That is a different kind of environment than broad market panic, and it favors stock-specific and sector-specific positioning over defensive cash holdings.
What Just Happened with Alphabet and Tesla
Alphabet reported Q2 2026 revenue of $119.8 billion, up 24% year over year, beating analyst expectations of approximately $116.9 billion. Google Cloud revenue surged 82% to $24.8 billion. The Cloud backlog grew to $514 billion, an increase of over $50 billion sequentially. Google Search revenue rose 17% to $63.3 billion. YouTube advertising brought in $11.1 billion, up 13%.
Strong numbers. Real growth. And the stock dropped roughly 6%.
Here is the thing. The headline EPS figure of $9.11 was inflated by approximately $6 to $7 in unrealized investment gains from holdings including Anthropic and SpaceX. Strip those out and core operating EPS was closer to $2.90, roughly in line with expectations. More importantly, quarterly capital expenditures hit $44.9 billion, a 101% increase year over year, and free cash flow turned deeply negative at negative $5.9 billion. Alphabet raised its full-year capex guidance to $195 to $205 billion, well above the prior guidance range of $180 to $190 billion and significantly above what analysts had projected.
The market is not punishing Alphabet for its revenue growth. It is questioning whether the company can convert record AI infrastructure spending into sustainable margin expansion. That is a different conversation than it was six months ago. The full-year capex target now sits at roughly double the prior year’s level.
Tesla’s story follows a similar pattern, though the specifics are distinct. Revenue came in at $28.24 billion, up 26% year over year and above analyst estimates of approximately $25.7 billion. Deliveries hit a record 480,126 vehicles in Q2, up 25% year over year. FSD subscriptions reached 1.48 million, up 56% annually. North American FSD attach rates exceeded 55% of new deliveries.
But operating income collapsed. GAAP operating income fell 57% year over year to just $398 million, with operating margin narrowing from 4.1% to 1.4%. Adjusted EPS came in at $0.33, well below the $0.51 consensus. Gross margin slid to 16.8% from 17.2% a year ago, and analysts had expected 19.4%. Capital expenditures jumped 142% to $5.79 billion, and free cash flow turned negative at $1.09 billion. Regulatory credit revenue, which had been a meaningful margin contributor, cratered to $146 million from $439 million in Q2 2025, a direct consequence of the federal EV tax credit expiring last September and the policy change that removed the penalty automakers once paid for missing fuel-economy standards.
Both companies are in a version of the same transition: record-scale spending on future infrastructure at the expense of near-term profitability. For a market that spent months pricing in AI monetization, that trade-off is getting harder to justify at current multiples when oil is at $100 and the Fed is recalibrating toward potentially hiking rates.
Iran War TRUTH: What Was Revealed Behind Closed Doors
There’s a strategy behind the Iran war.
I know because I heard it directly in a closed-door meeting with a source whose connections run deep into global power networks.
He walked me through the real purpose and the massive deal tied to it.
Why Chevron (CVX) Is in Focus
While Alphabet and Tesla dominated the headlines, Chevron quietly rose 1.00% on Thursday, closing at $192.98 and sitting at a key technical juncture. ExxonMobil gained 1.81%, closing at $154.45. The energy sector was one of the only areas of the market that held its footing through one of the sharper broad-market selloffs of the year.
That divergence is worth taking seriously. When defensive-dividend sectors and inflation-benefiting sectors outperform during a broad decline, it is a signal about where capital is rotating, not just a one-session anomaly.
Slight tangent worth noting: Chevron’s Q2 earnings call is scheduled for July 31. That means the stock is moving into its earnings window with oil above $100, an upgraded price target from TD Cowen (raised to $200 from $197 on Wednesday), continued buy ratings from JPMorgan and BMO Capital, and a macro backdrop that directly benefits its core business. The combination of a live catalyst on the horizon and a favorable macro environment is exactly the kind of dual confirmation active traders should look for before entering a position.
ExxonMobil is up 31% year to date. Chevron is up approximately 23% to 29% depending on the measurement date, having recovered roughly 13% from its early July lows while still sitting approximately 10% below its 52-week high of $214.71. That gap creates a potential range of movement that is not yet fully closed, which is different from chasing a stock already at all-time highs.
Technical Picture: CVX
Chevron’s chart structure tells a clear story right now. The stock is trading above both its 20-day simple moving average at approximately $177 and its 50-day SMA at approximately $182. That is a sign of a recovered trend, not a stock still digging out from a hole.
The RSI on Thursday was approximately 69.7, pushing toward overbought territory but not yet there. That level often produces a modest pause or consolidation before continuation, rather than immediate reversal, especially when the macro driver (oil prices) is still applying upward pressure.
Key resistance sits right at current levels near $192 to $193, which aligns with the session’s closing price. This is the ceiling traders have been watching. A sustained close above $195 on meaningful volume would signal that the resistance is being absorbed and that the next leg higher toward the $200 to $205 range is becoming more probable. The 52-week high at $214.71 remains the larger target zone for a multi-week continuation.
Support on the downside is layered. The first meaningful zone is around $182 to $183, which corresponds to the 50-day SMA. A break below that level, particularly on a closing basis, would call the current bullish structure into question. The secondary support zone sits near $165 to $166 based on the longer-term chart structure.
Volume on Thursday registered at approximately 6.14 million shares versus the daily average of 6.79 million. Volume is not yet surging in confirmation, which is a fair point of caution. Traders watching for confirmation of a resistance break should monitor whether volume expands meaningfully if CVX pushes above $195.
Iran War TRUTH: What Was Revealed Behind Closed Doors
There’s a strategy behind the Iran war.
I know because I heard it directly in a closed-door meeting with a source whose connections run deep into global power networks.
He walked me through the real purpose and the massive deal tied to it.
The Catalyst: Oil, Iran, and the Fed
The catalyst here is not one thing. It is the interaction of three separate forces that are all pointing in the same direction for energy stocks over the next several sessions.
First: Brent crude above $100 is a direct revenue and earnings driver for integrated oil majors. S&P 500 energy sector earnings are currently forecast to climb 57% in calendar year 2026. That is a fundamental story, not a speculation. When oil moves from $94 to $100 in a single session, the earnings uplift for the next quarterly reporting cycle is immediate and significant. Chevron reports July 31. Any guidance language that references sustained oil prices above $90 to $100 should support continued multiple expansion or at minimum, resistance to the multiple compression that hit tech today.
Second: The Federal Reserve is being forced to reconsider its easing bias. Fed funds futures are now pricing an 82% probability of a rate hike at the September FOMC meeting, up from 52% just one week ago. The current federal funds rate sits at 3.50% to 3.75%, and markets were already on edge about whether the next move would be a hike or a hold. Weekly jobless claims of 187,000 for the week ended July 18 came in well below the 212,000 consensus, indicating a labor market that is not breaking down. A strong labor market plus $100 oil is a combination that historically gives central banks license to prioritize inflation control over growth accommodation. Higher rates for longer hurt growth stocks and credit-sensitive sectors. They do not hurt a cash-generative oil major with low debt-to-equity ratios and a 3.80% dividend yield.
Third: The geopolitical trajectory is not improving. Houthi attacks on Red Sea tankers, U.S. threats of additional strikes on Iranian infrastructure, and the collapse of the earlier ceasefire attempt all suggest that the supply disruption risk through the Strait of Hormuz remains elevated. This is not a situation that is resolving cleanly over the next week. That means the oil price floor is supported by something real, not just sentiment.
Sector Rotation Context
Today’s session accelerated a rotation that has been developing for several weeks. Communication Services fell 1.3%, Consumer Discretionary dropped 0.8%, and Technology was among the worst performers. Utilities gained 2.3%. Energy held positive ground. That is classic defensives-and-inflation-beneficiaries outperformance on a risk-off day, and it is a pattern that tends to persist for at least several sessions once it establishes itself with this kind of breadth.
The XLE Energy ETF has been one of the strongest-performing sector funds in 2026, up significantly from its early-year lows, with the sector benefiting from both oil price appreciation and the Iran conflict premium. The concentration risk in XLE is real: nearly half the portfolio sits in ExxonMobil, Chevron, and ConocoPhillips. But that concentration also means that when oil runs, the ETF runs with it in a straightforward and predictable way.
Microsoft, Meta, Amazon, and Oracle each fell between 3% and 5% on the session, following Alphabet’s capex announcement. The market is recalibrating its view of AI infrastructure spending economics across the entire hyperscaler group. Goldman Sachs and Robinhood both fell over 3%. RTX and Comcast were notable outperformers, both beating earnings estimates and trading higher. Chevron advancing 1.77% on the Dow Jones best-performers list rounded out the picture.
Scenario Modeling: CVX Over the Next 1 to 5 Sessions
Bull Case
Brent crude holds above $98 to $100 into next week. CVX pushes through $195 resistance on expanding volume. The July 31 earnings call delivers strong Q2 results anchored by realized oil prices well above last year’s comparable period, and management guides conservatively, allowing the stock to grind toward $200 to $210 into August. Fed rate hike odds remain elevated but do not produce a systemic risk-off event. The XLE ETF confirms the move with breadth across multiple energy names. Catalyst: any additional Middle East escalation or supply disruption announcement accelerates this case.
Base Case
CVX consolidates between $185 and $195 over the next several sessions as the market digests the sharp earnings-driven tech selloff and assesses whether oil can sustain the $100 level. The stock respects its 50-day SMA as support and does not give back today’s gains in any meaningful way. Energy sector relative strength continues, but positioning remains selective rather than broad. Approaching earnings on July 31, implied volatility likely expands, creating options premium opportunity for those who prefer defined-risk structures around the event.
Bear Case
Any credible signal of de-escalation in the Iran conflict, a ceasefire announcement, or a diplomatic opening would immediately pressure oil prices lower. A return to $85 WTI or below would likely pull CVX back toward the $175 to $180 range fairly quickly. Additionally, if the Federal Reserve surprises markets at its July 29 meeting with a more aggressive signal than expected, risk sentiment could deteriorate broadly, pulling even energy stocks lower in the short term despite their fundamental support. A close below $182 on CVX would be a warning sign that the current technical structure is failing.
The Best Time Of Day To Trade For A Better Retirement
This little known trading window is turning even novices into consistently profitable investors, and now, you can learn to take advantage of it for free!
With expert Dave Aquino’s latest free guide, “How To Master The Retirement Guide”, you’ll get step-by-step instructions to one of the most powerful market plays around today.
Active Trader Framework
Here is where I am at with this: the risk management side of this trade is actually one of the cleaner parts of the picture. You have a well-defined technical level at $182 to $183 (50-day SMA) that serves as your invalidation point. Above that, the trend is intact. Below that, on a closing basis, the case for energy sector leadership weakens materially.
Key levels to monitor over the next several sessions:
- Resistance to watch: $193 to $195 (current ceiling, prior swing high area)
- Extension target if resistance clears: $200 to $205 (analyst consensus price target zone, TD Cowen raised target this week)
- Longer-term target: $210 to $215 (approaching 52-week high at $214.71)
- First support: $185 to $187 (recent consolidation zone)
- Key support: $182 to $183 (50-day SMA, structural level)
- Invalidation level: A closing break below $182 would signal the bullish thesis is weakening
- Catalyst date: Chevron Q2 earnings, July 31, 2026
- Macro event: FOMC meeting July 29, federal funds rate decision
Volatility considerations matter here. The FOMC meeting on July 29 lands before Chevron’s earnings on July 31. That compresses two major catalysts into a three-day window. Traders who are long into that window should size accordingly, because the scenario in which the Fed surprises hawkishly and oil simultaneously pulls back is a low-probability but high-impact outcome that would hit CVX on two fronts simultaneously.
For traders who prefer to wait for confirmation, the setup is actually more attractive if CVX pulls back toward $185 to $187 into early next week. That would offer a better entry against the 50-day SMA with less technical extension risk heading into the July 31 earnings event. Patience here is not a failure of conviction. It is risk management applied to a real catalyst calendar.
The broader watchlist for the energy sector should include ExxonMobil (XOM) at $154.45 with its 31% year-to-date gain still intact, as well as sector-level positioning via XLE for those who prefer broader exposure over single-stock risk. ConocoPhillips remains one of the three largest XLE holdings and has similarly benefited from the oil price run.
Risk Assessment
No trade framework is complete without an honest look at what breaks it.
The primary risk is geopolitical resolution. The oil price premium embedded in current energy stock valuations is almost entirely a function of the U.S.-Iran conflict and Strait of Hormuz supply disruption fear. If that fear dissipates, even partially, the speed and magnitude of the oil price reversal could be significant. We saw this dynamic play out earlier in the summer when a tentative ceasefire caused sharp selling in energy names. That ceasefire collapsed. But the pattern is clear: energy stocks are pricing in a sustained conflict, and any credible signal of resolution produces rapid unwinding of the war premium.
The second risk is energy sector earnings. Chevron’s Q2 call on July 31 will reveal whether realized oil prices during the quarter translated into the earnings growth that current valuations assume. Consensus energy sector earnings growth of 57% for 2026 is a high bar. Any miss on margins, production volumes, or forward guidance could create a sell-the-news dynamic even if revenue beats. That is a pattern that just played out in Big Tech today, and it would be naive to assume energy is immune to the same dynamic.
The third risk is a broader risk-off event tied to the Fed. If the July 29 FOMC meeting delivers a surprise rate hike rather than a hold, the market reaction could be disorderly across multiple asset classes simultaneously. Energy stocks are not immune to a broad deleveraging event, even when their fundamental case is sound.
Trader’s Checklist
Before the next session opens, here is what to monitor:
- Brent crude and WTI price action overnight and into Friday’s open. Sustained strength above $98 reinforces the bull case; a reversal below $92 changes the picture meaningfully.
- CVX volume on any push above $193 to $195. A volume-confirmed close above that range would represent a meaningful technical confirmation signal.
- Any diplomatic developments between the U.S. and Iran. Secretary of State Rubio’s posture remains aggressive, but the bond market will reprice quickly on any credible ceasefire signal.
- The FOMC meeting on July 29. Current odds favor a hold at 3.50% to 3.75%, but the minority probability of a hike has surged to approximately 38%. Watch Fed communications for any language shift.
- CVX’s earnings call on July 31. Key metrics to track: realized oil price per barrel, production volumes, updated full-year guidance, and commentary on capital allocation priorities including buybacks and dividends.
- Broader sector confirmation. If XLE, XOM, and ConocoPhillips are all advancing on the same session that CVX pushes through resistance, the move has greater institutional conviction behind it than a CVX-only move.
- Tech sector stabilization. If Alphabet, Microsoft, and the broader megacap group find footing, risk appetite returns to the broader market. That could lift all boats and reduce the urgency of the energy sector defensive trade.
July 23 was a day where the market told you something it had been hinting at for weeks. AI spending is enormous, and investors are growing impatient waiting for the returns to match the outlays. Meanwhile, $100 oil and a labor market printing 57-year low jobless claims is the kind of macro backdrop that rewards preparation over reaction.
The trade here is not chasing a stock that already ran. It is identifying a sector where the fundamental driver (oil above $100), the technical structure (trend intact above key moving averages), and the catalyst calendar (earnings in eight days) are all aligned. CVX at current levels offers that framework with a defined risk level below $182 that either holds or tells you the thesis has changed.
Whether or not it plays out is beside the point. Having the framework in place before the session opens is the entire game.
For informational and educational purposes only. Not investment advice. Trading involves risk, including loss of principal.