August 28, 2026
$442 Billion in One Session.
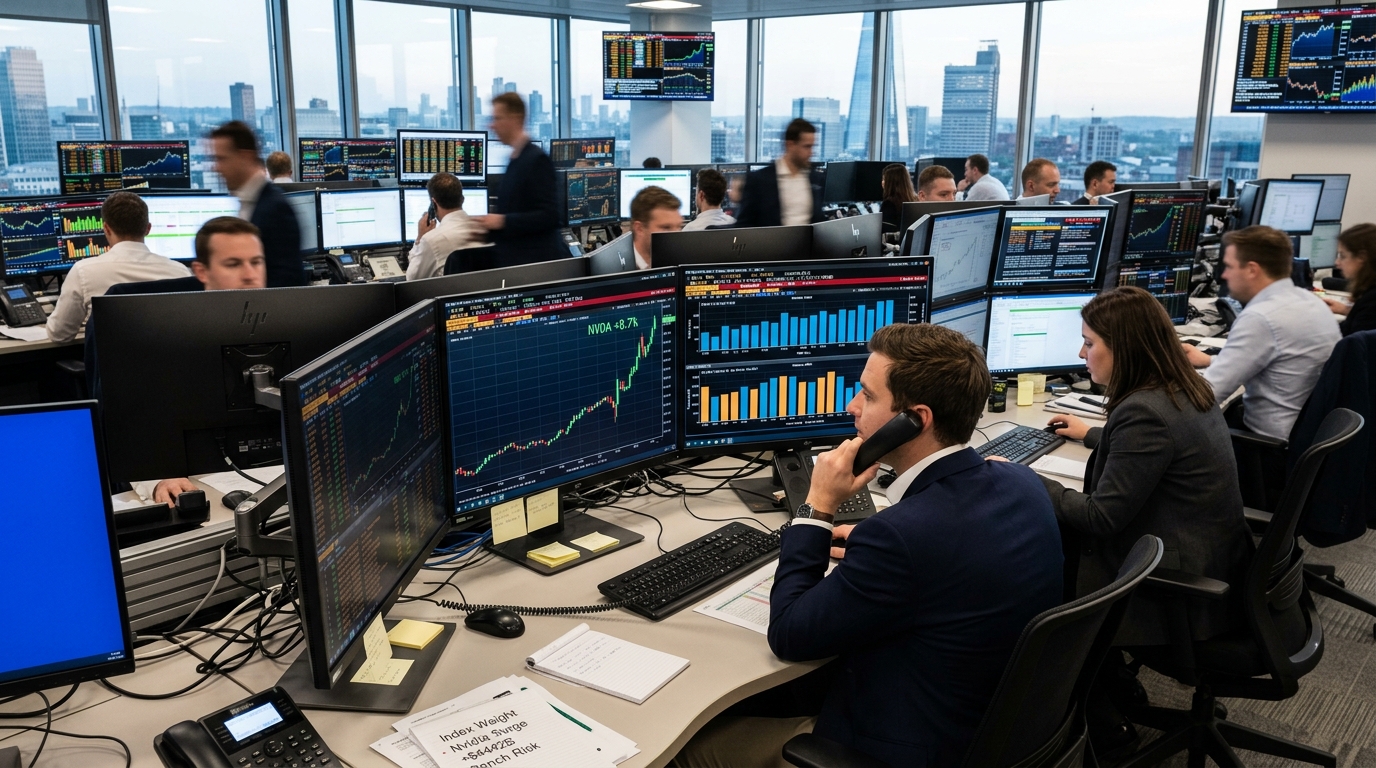
Nvidia’s 8.7% surge wasn’t just a stock story. It reset benchmark risk across passive portfolios.
Two record-scale single-day market-cap gains in less than a month, both in names that sit at the very top of every major cap-weighted index. That is not a coincidence. It is a structural condition, and active traders who treat it as background noise are mispricing their own benchmark exposure.
- NVDA closed at $227.98 on Thursday, up 8.74%, adding about $442B in market value, second only to Microsoft’s roughly $450B single-session gain on July 30, 2026
- Q2 FY27 revenue came in at $96.2B, up 106% year over year, with data center at $89B (about 92.5% of total sales)
- Management guided Q3 revenue to $108B (plus or minus 2%) and guided gross margin to about 74% (plus or minus 50 basis points)
- NVDA’s market cap now stands near $5.5T; with the S&P 500 top 10 constituents at about 37.6% of index weight, single-name moves at the top are now index-level events
- The S&P 500 rose 0.72% and the Nasdaq 100 gained 1.43% Thursday, even as most S&P constituents closed lower
- AVGO gained 4.49%; AMD fell 0.89%; NVDA trading volume was roughly 293 million shares, well above its typical 3-month average (roughly 140 million)
- The top 10 S&P 500 constituents now account for about 37.6% of total index weight, above dot-com-era levels cited by major research desks (around 27%)
The Benchmark Problem Nobody Advertises
Thursday’s session illustrates exactly why NVDA’s weight matters beyond the stock itself. The tech rally lifted the S&P 500 even as most of its shares fell. That sentence is the whole story. A fund manager running a diversified book that was flat or slightly negative on the day still underperformed SPY by roughly 70 basis points, not because of what they owned, but because of what they didn’t own, at the weight the index demanded.
Nvidia is one of the largest constituents in the S&P 500, and a 10% move in Nvidia’s stock would, all else equal, shift the S&P 500 by roughly 60 to 80 basis points depending on the day-to-day index weight. Thursday’s 8.7% move was consistent with that kind of index math. Concentration is the point: the top 10 constituents now sit near 37.6% of the index, and that makes the index itself a concentrated AI-linked bet, whether the buyer acknowledges it or not.
Sector Breadth: Who Moved With NVDA and Who Didn’t
The peer reaction on Thursday was uneven, which matters for the five-day breadth test now underway. Broadcom closed up 4.49% at $371.54, while AMD fell 0.89% to $476.67, as Nvidia’s results kept AI-chip investors focused on data center demand. AVGO’s move is substantively different from AMD’s. Broadcom is a direct beneficiary of custom silicon demand. AMD’s decline reflects the market’s ongoing skepticism about its ability to capture meaningful GPU share from NVDA at scale.
He Doesn’t Buy Gold. He “Skims” It.
A former hedge fund manager ranked in the top 1% by Barron’s has developed a three-step strategy to profit from gold – without buying a single ounce.
His followers have had the chance to collect $2,975… $3,781… and even $6,786 at a time. With a 73% win rate.
He calls it “Gold Skimming.” And he’s just revealed the full strategy for the first time.
Salesforce and CrowdStrike led software firms higher on solid forecasts, which suggests the AI confidence trade is broadening across the software stack, not just silicon. That breadth, if it holds through the next three to four sessions, would confirm a genuine regime move rather than a single-stock catalyst that fades.
The Financials Behind the Move
Nvidia reported revenue for the second quarter ended July 26, 2026, of $96.2 billion, up 18% from the previous quarter and up 106% from a year ago. Data center revenue hit $89B. The company guided Q3 revenue to $108B (plus or minus 2%), and guided gross margin to about 74% (plus or minus 50 basis points). The guidance beat is what drove the session.
Technical Framework
NVDA has shot up to touch the upper resistance range of its large symmetrical triangle, with immediate resistance at $227.76 to $228. A daily close above this range would confirm the breakout with an upside target at $236.43, $242.45, and $248.73. The 50-day simple moving average sits near $207.75, which now functions as a key reversion reference. Trading volume reached roughly 293 million shares, well above its three-month average, the kind of volume that typically validates a breakout rather than exhausting it, though follow-through in the next two sessions is the confirmation traders need.
Scenario Modeling
Bull Case
NVDA holds above $228 on a daily close, confirming the triangle breakout. Breadth expands: AVGO, software names, and power infrastructure stocks all sustain gains through next week. The Nasdaq 100 clears its August 4 closing level with participation from more than half its constituents. Price targets of $236 to $248 come into play within two to three weeks.
What is “The Presidio Initiative”?
A single $20 million check delivered to a former military base may have launched the biggest megaproject in American history.
Base Case
NVDA consolidates between $210 and $228, digesting the earnings gap. The broader index holds gains modestly. Sector breadth in chips is mixed, with AVGO tracking the bull case and AMD remaining a laggard. SPY finds support near $768, consistent with Thursday’s close. The benchmark concentration effect fades as a conversation topic until the next mega-cap catalyst.
Bear Case
NVDA fails to hold $220 in the days following the gap, and the symmetrical triangle resolves as a false breakout. A reversal here would reclaim roughly half the session’s gains, dragging SPY down 40 to 50 basis points purely on NVDA’s weight. Macro risk: any deterioration in the PCE data released Friday or an upside surprise in jobless claims could compress multiples quickly. The concentration that amplified Thursday’s gain becomes the mechanism for asymmetric downside.
Active Trader Strategy Framework
The positioning question for the next five sessions is not whether NVDA was justified; the numbers made the case. The question is whether benchmark-relative exposure is calibrated to current index math. Traders running meaningful underweights to NVDA relative to SPY or QQQ are carrying active short exposure to one of the index’s largest constituents, regardless of their intent. That is a position, and it should be sized deliberately.
Gold Majors Are Running Out of Gold
Here’s a “secret” the largest gold miners don’t advertise… They’re running out of gold. The second-biggest miner on earth is watching its production collapse from 2 million ounces a quarter down to 719,000 – and another major just paid $15 billion for a rival in the biggest gold deal in history, only to see its output stay flat. They can’t drill their way out fast enough, so they have to buy their way out. Which means gold just entered its acquisition phase – where the best small miners get bought out at whatever premium it takes. Already, my readers have enjoyed overnight buyout premiums of 40%… 67%… 79%… and the acquisition phase has barely begun.
Go here to see details on my current top three buyout picks.
For NVDA itself, the $227.76 to $228 zone is the decision level. A confirmed close above that level shifts the risk framework toward continuation; a rejection keeps the consolidation range intact. The 50-day simple moving average near $207.75 represents the structural floor for any pullback that does not break the post-earnings thesis.
On peer names: AVGO’s reaction deserves respect; its 4.49% gain on Thursday is grounded in its own fundamental story, not simply sympathy. AMD’s underperformance on the same day that every other chip name rallied is information. Monitor whether that divergence persists or corrects over the next week.
Preparation and risk discipline matter more than any single session’s momentum. The largest single-day market-cap gains in U.S. equity history have been coming from the same ultra-mega-cap cluster, and that concentration is now the tradeable macro condition. Volatility is the environment, not the exception. Position accordingly.