August 31, 2026
Bonus Content: Auto Sales Land Tuesday. Here’s the Real Read.
Hi Trader,
Most “gurus” who teach beginners how to trade options start in the wrong place…
Because they immediately launch into complicated concepts like Greeks, spreads, and implied volatility.
And before long, most new traders are completely lost… and move on.
The free guide I want to share with you today takes a different approach.
Instead of overwhelming you with technical details…
It starts with the basics and shows you exactly how options work, why traders use them, and how they can fit into a simple trading plan.
If you’ve ever wanted to understand options but didn’t know where to start…
This is your chance.
Click here and get your free copy now.
To your trading success,
Dave Aquino
Lead Options Trader, Base Camp Trading
Auto Sales Land Tuesday. Here’s the Real Read.
Tuesday’s auto sales reports arrive carrying a built-in optical problem. The year-over-year headline will look ugly: retail transactions are projected at 1,142,700 units, a 6.9% decline from August 2025. Traders who stop there are reading the wrong number.
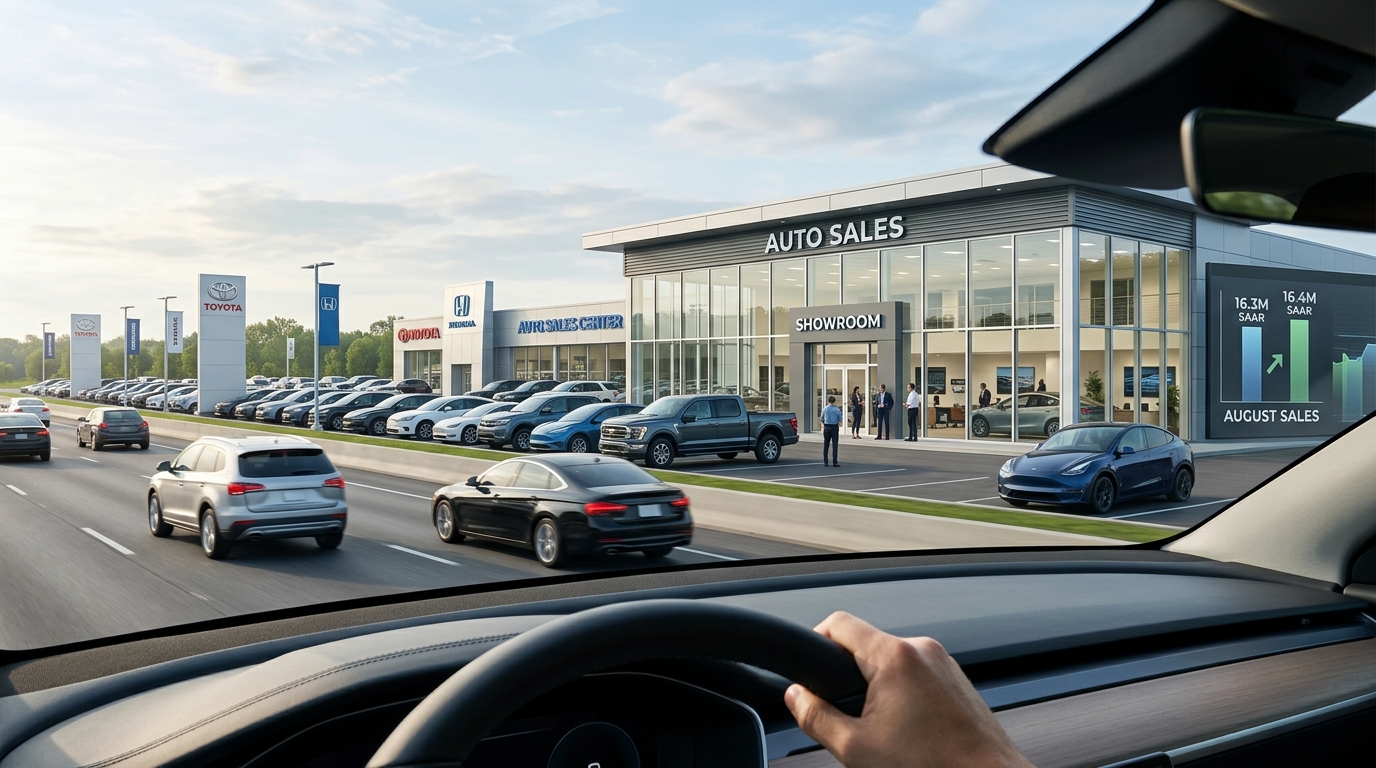
The underlying rate is what matters. Cox Automotive puts the SAAR near 16.3 million, and JD Power and GlobalData land at 16.4 million. Two forecasters, two methodologies, same message: demand has not cracked. The SAAR has now held at or above 16 million for six consecutive months.
Strip Out the Distortion
August 2025 sales were inflated by the widely discussed pull-ahead ahead of the federal clean-vehicle credit sunset. Under current IRS guidance tied to 2025 legislation, the clean-vehicle credits were not available for vehicles acquired after September 30, 2025, which helped pull some EV demand into late summer 2025. The Labor Day holiday, traditionally one of the biggest vehicle sales weekends of the year, also fell into the August 2025 reporting period versus September this year. Both effects compound the year-over-year retail decline artificially.
The comp distortion has a direct implication for how traders should read the OEM-specific numbers from GM, Ford, Stellantis, Toyota, and Tesla when they report in early September. Any name that beats a 6.9% retail decline on a selling-day-adjusted basis is gaining real share in a normalized demand environment.
Hybrids Take the Share EV Lost
Hybrid share of retail sales is expected to reach 18.2%, up 4.8 percentage points from last year, despite inventory constraints on the best-selling models. Incentive spending on internal-combustion and hybrid vehicles is expected to increase $651 per unit year over year, rising 26.2% to $3,140 in August 2026. EV incentives moved in the opposite direction. EV incentive spending is forecast to decline $2,297 per unit, or 19.9%, to $9,228, contributing to a 4.6 percentage-point decline in EV share.
Toyota, which has captured the consumer shift away from pure EVs, is positioned as the strategic hybrid winner in the current market configuration. Tesla’s year-to-date performance remains weak versus the broader market and is being driven by company-specific factors separate from Detroit’s product-cycle dynamics. GM last closed at $86.27. Ford carries a Wells Fargo Sell rating and an $11 price target amid a wiring-harness recall affecting 565,691 Bronco and Bronco Raptor vehicles.
The Consumer-Credit Signal
The SAAR holding at 16.3 million looks resilient. The consumer-credit numbers underneath it are less comfortable. Average monthly payments are expected to rise 3.7% to an August record of $812, while interest rates are projected to drop 6 basis points to 6.55%, the lowest August level since 2022. The average monthly payment for a new vehicle already reached a record $770 in Q1 2026, up 2.9% from a year earlier.
Cox Automotive Senior Economist Charlie Chesbrough attributed demand resilience to the buyer profile: “New-vehicle buyers are likely in a better position than the general consumer,” pointing to higher incomes and stronger credit. A market mix skewed toward trucks and SUVs continues to drive average transaction prices higher. That mix-driven ATP supports OEM revenue lines but concentrates credit exposure at the top end of the income distribution, a structural watch item as rates stay elevated.
Scenario Framework
Bull Case: Tuesday reports show Toyota and GM retail share gains above the distortion-adjusted baseline. Hybrid inventory constraints ease through September, extending the 18.2% share trajectory. The 16.3–16.4 million SAAR is revised to reflect clean underlying demand, and domestic OEM stocks clear recent resistance levels.
Base Case: SAAR confirms at 16.3–16.4 million. Retail down approximately 7% year over year is correctly read as a comp artifact, not a demand signal. Hybrid outperformance benefits Toyota and GM; Ford faces incremental recall headwinds. Tesla’s August volume provides no positive catalyst for the stock absent a separate autonomous-driving update.
Bear Case: Retail weakness is deeper than the comp explains, signaling that $812 monthly payments and 6.55% financing rates are beginning to price out mid-tier buyers. Subprime delinquency data released alongside Q3 earnings becomes the more relevant credit read, pressuring the sector broadly into the fall.
Active Trader Framework
The auto sector trade heading into Tuesday is not a directional bet on the SAAR headline. It is a relative-value read: which OEMs demonstrate volume resilience on a selling-day-adjusted basis, and which carry the highest hybrid exposure against a 4.8-point share tailwind. Monitor GM and Toyota for gap behavior at open in early September. Ford’s recall overhang and Tesla’s relative underperformance suggest both require stock-specific catalysts rather than sector-level positioning. The 16.3 million SAAR is not the signal. The mix shift within it is.