September 2, 2026
A record August at the pump is now a portfolio problem, and divergence is visible in airline stocks.
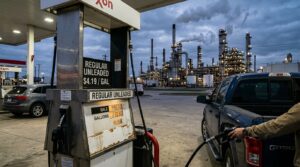
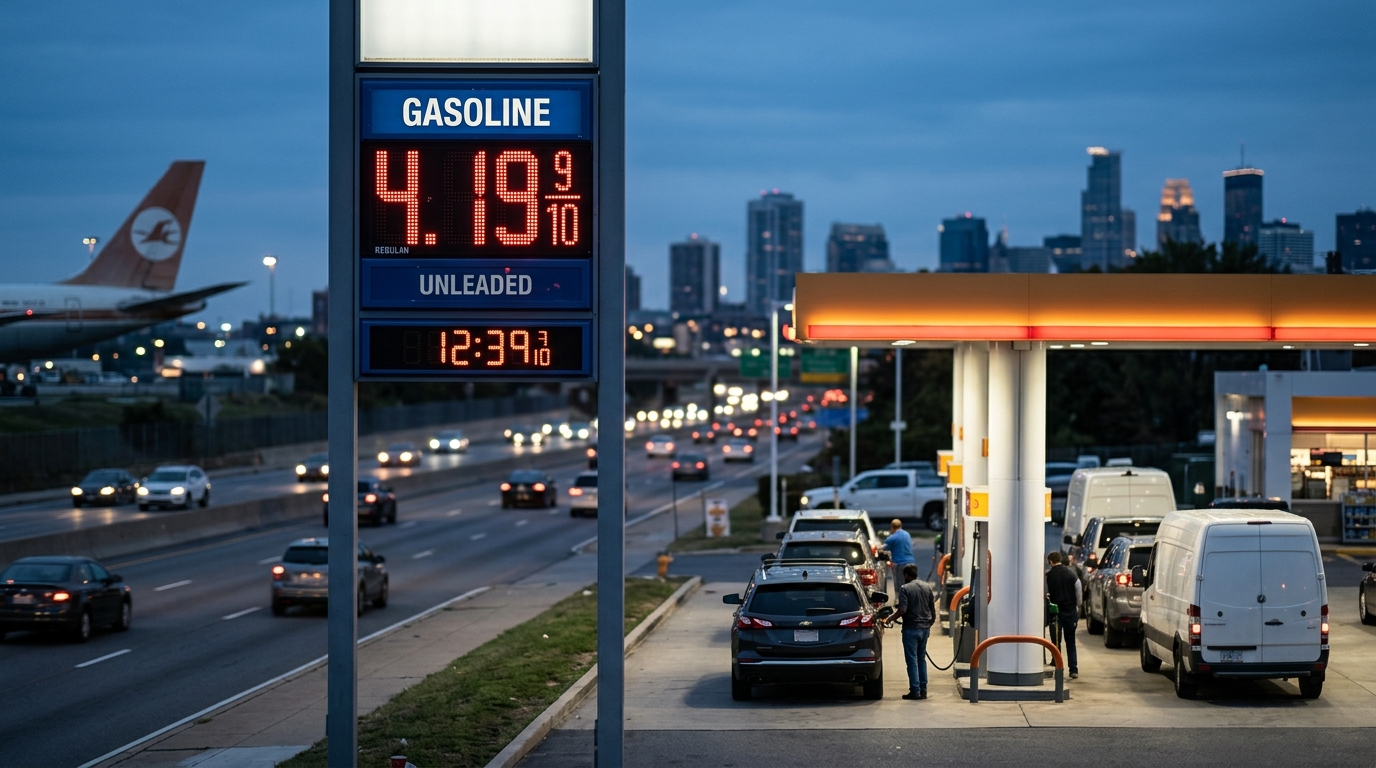
August 2026 closed with a distinction no prior year holds: the national average price of gasoline stayed above $4 a gallon for every day of the month, according to AAA. That is not a rounding issue or a regional quirk. It is a structural shift in the cost baseline that households and corporate income statements are still absorbing.
When a U.S. ally moved to impose levies on one American energy company…
A direct warning followed at the highest level.
Today that same company is generating over $3 billion in operating income…
And has entered a partnership with one of Wall Street’s leading AI positions.
Out of 23,281 publicly traded stocks, this is the only one that clears every criterion on the checklist analysts are calling a “unicorn” screen.
- National gasoline average was about $4.09/gallon in late August, putting August on track to be the costliest August on record and above the prior August record set in 2022.
- Diesel reached about $5.60/gallon in late August, up roughly $1.90 year-over-year (about a 51% increase), and approaching AAA’s all-time diesel record of about $5.82 set in June 2022.
- Brent crude rose about 5% to around $95/barrel on September 2 as U.S.-Iran fighting around the Strait of Hormuz intensified.
- Delta Air Lines (DAL) shares are up about 10% year-to-date, while American Airlines (AAL) shares are down about 12% year-to-date, with a roughly $53 billion vs. roughly $9 billion market cap gap reflecting very different balance-sheet and earnings resilience under fuel stress.
- EIA’s August outlook projects Brent averaging $87/barrel in 2026, with most shut-in Middle East production largely restored in early 2027.
- Gasoline has traded at or above $4/gallon for most of August 2026. Put differently: August set a first-of-its-kind streak for the month, and that is the signal traders need to respect heading into Q4.
Macro Context: A Higher Floor, Not a Temporary Spike
The Hormuz conflict did not begin in late August. The latest round of escalation has been running for more than six months, and the strait remains the route that typically handles roughly one-fifth of global oil consumption. A June lull in hostilities briefly eased crude prices, but the reprieve did not hold into late summer. The EIA’s August 11 outlook assumes severe Hormuz transit constraints persist through August and that normalization takes time.
The September 2 military escalation, tied to U.S. strikes in and around the Strait of Hormuz, compounded the energy market’s anxiety entering the fall season. At around $95/barrel, Brent is roughly 21 points above the EIA’s July forecast of about $74/barrel for 3Q 2026. The EIA’s projection calls for oil to average $87/barrel across full-year 2026 and for most production to return near pre-conflict averages only in early 2027, with residual disruptions of about 0.6 million barrels per day extending into 2027. That is the baseline. Any diplomatic reversal in the strait could unwind prices quickly. Any further escalation could send crude back toward $100.
Sector Breakdown: Who Absorbs Costs, Who Passes Them
Gasoline at roughly $4.09 and diesel at about $5.60 are not equivalent pressures across the economy. Diesel, which moves nearly everything sold in America, feeds directly into logistics costs and supplier margins. Households paying materially more per month at the pump have less for restaurants, electronics, and apparel. Watch the XLY consumer discretionary ETF as an indirect Brent barometer: consumer-facing companies with limited pricing power are exposed to every dollar crude adds above $85.
The airline sector tells the clearest story about how cost structure determines survival in a high-fuel environment. Delta Air Lines is up about 10% year-to-date, while American Airlines has declined about 12% year-to-date. Delta’s Amex credit card partnership, loyalty revenue, and its refinery asset help cushion margins in ways that American cannot replicate. American’s Q2 2026 revenue hit a company record of $16.7 billion, up 16.3% year-over-year, yet management guided Q3 2026 to an adjusted loss range of $0.70 to $0.10 per diluted share. Record revenue alongside earnings uncertainty in the same breath is the fuel cost problem in one sentence.
In case you missed it — your copy of “Simple Options Trading For Beginners” is still available at no charge through your current access link.
This training is scheduled to move to a paid format, so downloading now means you lock in your copy at no cost, regardless of future pricing.
Worth grabbing while the access window is open.
Complimentary Access: Simple Options Trading For Beginners — Download Here
Technical Framework: Key Levels to Track
Brent near $95 sits near recent highs. The critical technical test is whether crude can hold the $90 to $95 range or whether the September escalation becomes a sustained breakout toward $100. The XLY ETF’s 50-day moving average has acted as a pivot level through August; a sustained break below it on volume would signal institutional risk reduction in consumer discretionary positioning. On the energy side, the XLE energy ETF’s relative strength against XLY is the rotation signal worth monitoring on a weekly basis.
Scenario Modeling
Bull Case: A credible diplomatic breakthrough in Hormuz transit negotiations drives Brent back toward $75 to $80/barrel by mid-October. Gasoline falls toward $3.40 to $3.60 by Q4, inline with the EIA’s July forecast. Consumer discretionary names recover, and airline stocks broadly stabilize. Catalyst required: verifiable resumption of tanker traffic at scale.
Base Case: Brent trades in the $85 to $95 range through October. Pump prices ease modestly on the seasonal winter-blend transition but remain well above $3.80. Consumer spending compresses at the margin. Airlines with diversified revenue, Delta and United, outperform AAL through Q3 reporting season. Catalyst: continued low-grade Hormuz disruption with no full escalation or resolution.
Bear Case: A significant Iranian retaliatory strike on Gulf infrastructure or a direct closure of Hormuz transit routes sends Brent back toward $100 to $110. Gasoline approaches May 2026 highs near $4.56. Consumer discretionary and airline stocks without structural fuel hedges face sharp earnings estimate cuts ahead of October reporting.
BlackRock’s Bitcoin ETF has become their top-performing revenue line. JPMorgan now processes $1 billion daily through digital asset infrastructure. 170 public companies have repositioned their treasury holdings. The U.S. debt-to-GDP ratio is projected to reach 143.4% by 2035 — a level that historically accelerates pressure on reserve currency demand. One credible policy response is AI-driven productivity growth, and AI at scale requires a rebuilt financial infrastructure layer. In this live presentation, ex-Wall Street CFA Tan Gera walks through the convergence of these forces and how a comparable structural realignment produced a re-rating of 12,480% for early-positioned investors.
Active Trader Strategy Framework
The portfolio question is not whether to own energy. It is whether current consumer discretionary and airline positions reflect a $90-plus crude environment in their earnings models. Stress-test holdings against a scenario where Brent holds between $85 and $100 through December. Companies with pricing power, diversified revenue, and disciplined cost management will separate from those that simply absorb the hit. Before the next earnings season opens, identifying which holdings can pass costs through, and which cannot, is the most valuable work a disciplined trader can do.
Volatility in the Strait of Hormuz runs both directions. Any position sized for a prolonged crude spike must account for the speed at which oil can fall on a de-escalation headline. The two-sided risk is real, and position sizing should reflect it.
Conclusion
A month that rewrote gasoline price history is entering Q4 earnings season as a dominant portfolio variable. The sector divergence, roughly 22 percentage points between Delta and American Airlines year-to-date, proves that preparation and cost-structure analysis matter more than macro calls. The macro backdrop is known. What separates outcomes now is execution discipline at the position level.